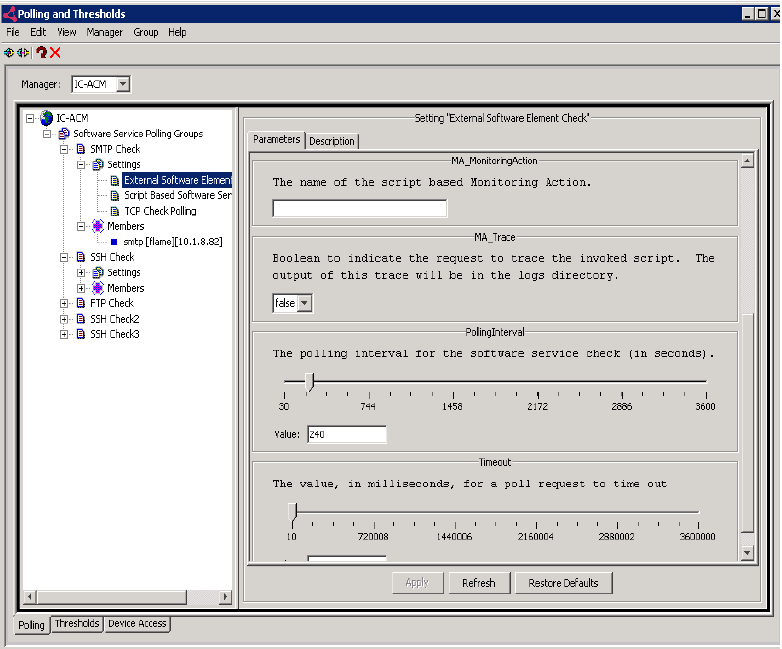
The tabs that appear on a Polling and Thresholds Console depends on the type of Domain Manager to which the console is attached. Figure Polling and Threshold console provides an example of a Polling and Threshold console.
When attached to IP Availability Manager or IP Performance Manager, for example, the Polling and Thresholds Console contains three tabs:
- Polling
Enables administrators to control the polling of the managed objects for monitoring purposes.
- Thresholds
Enables administrators to set thresholds for the polled data.
- Device Access
Enables administrators to specify credentials (such as login credentials) for access configurations and execution parameters.

The Polling and Thresholds Console is divided into two panels.
- The left panel displays the icon for the analysis domain in the upper-left corner and provides two tabs, Polling and Thresholds, at the bottom. When the Polling tab is selected, the console displays polling groups. Likewise, when the Thresholds tab is selected, the console displays threshold groups.
For each group, there are settings that provide adjustable parameters and a membership list of managed elements to which the settings are applied.
- The right panel remains blank until a group, setting, or member is selected in the left panel. When an item is selected in the left panel, the right panel displays additional information regarding that item.