


While the Global Console is the primary user interface for VMware Smart Assurance software, the VMware Smart Assurance Business Dashboard provides another means of viewing and responding to the analysis provided by VMware Smart Assurance Service Assurance Manager. The VMware Smart Assurance Business Dashboard provides additional features:
-
Dashboard viewlets can be displayed in any supported web browser from any location. The web clients do not require an installation of VMware Smart Assurance software.
-
Dashboard viewlets can be embedded into a web Portal, combining VMware Smart Assurance’ analysis with information from other sources.
Architecture of Service Assurance with Business Dashboard illustrates how the VMware Smart Assurance Business Dashboard integrates with VMware Smart Assurance Service Assurance Manager.
Figure 1. Architecture of Service Assurance with Business Dashboard 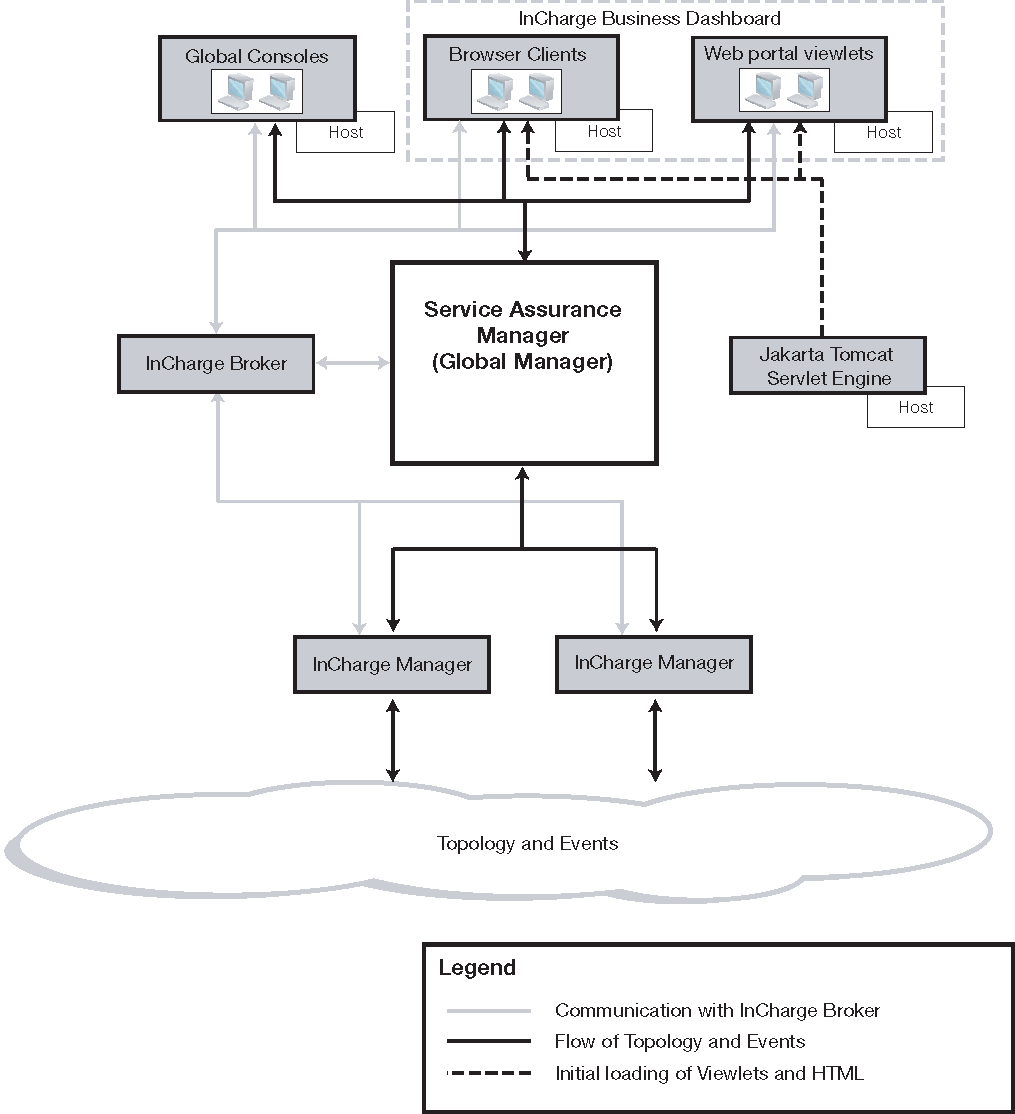
-
The following components, illustrated in Architecture of Service Assurance with Business Dashboard, are related to the VMware Smart Assurance Business Dashboard:
-
Global Manager consolidates topology and event information it receives from data sources such as VMware Smart Assurance Managers. The Global Manager provides this data to clients such as the Global Console or dashboard viewlets.
-
VMware Smart Assurance Business Dashboard is a collection of dashboard viewlets that are displayed in a web page. A viewlet can also be embedded within a web portal page or loaded from a dynamically generated URL.
-
Tomcat Servlet Engine serves the JAR files that compose dashboard viewlets and the map layout servlet. The servlet engine is installed as a service with the VMware Smart Assurance Business Dashboard. If you are already running a web server, you can use it to serve the necessary files to display dashboard viewlets.
