Assuming that VoIP Performance Manager is integrated with VoIP Availability Manager, Global Console client tools to access VoIP Performance Manager data are available for any of the following VoIP Availability Manager topology objects imported into the Global Manager:
-
CallManager
-
ConvergedCallManager
-
DS1Service
-
GatewayService
-
H323GateKeeper
-
MediaProcessor
-
PortNetwork
-
VoipPerformanceManager
-
SignalingService
Launching a VoIP client tool from one of these topology objects opens a web interface that loads a VoIP Performance Manager drill-down display relevant to the selected object and the tool itself. The drill-down display contain a collection of performance metrics associated with the object. This capability enables Global Console users to troubleshoot alarms involving specific VoIP topology objects.
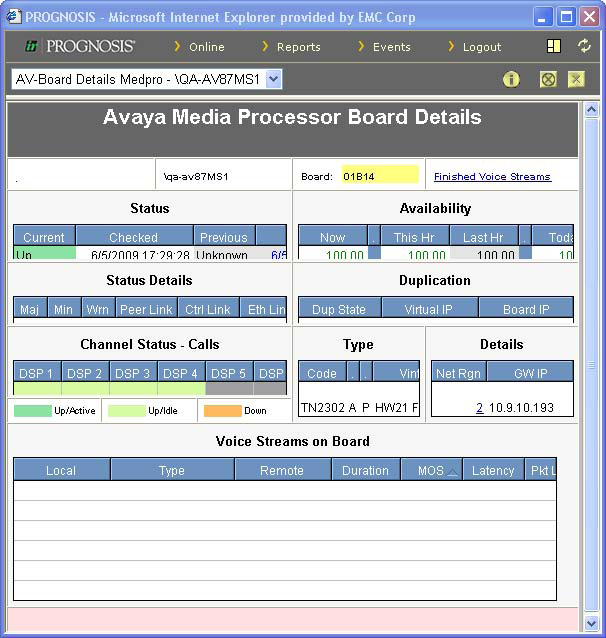
The VMware Smart Assurance VoIP Availability Manager Configuration Guide provides configuration information for VoIP client tools. The VMware Smart Assurance VoIP Management Suite Overview and Integration Guide provides an overview about the use of client tools. When configured, you can invoke a VoIP client tool by right-clicking a VoIP topology object in a Topology Browser attached to the Global Manager, then select the tool from the pop-up menu. For example, right-clicking a MediaProcessor object in the Topology Browser and then selecting Client Tools > Launch MedPro View from the pop-up menu launches the Media Processor drill-down display shown in VoIP Performance Manager’s Media Processor drill-down display—example.
The VMware Smart Assurance VoIP Performance Manager User Guide and the VMware Smart Assurance VoIP Performance Manager System Guide describe how to navigate the VoIP Performance Manager GUI and how to read drill-down displays.
Figure 1. VoIP Performance Manager’s Media Processor drill-down display—example 