


DORA metrics in Tanzu Developer Portal
This topic tells you about viewing DevOps Research and Assessment (DORA) metrics in Tanzu Developer Portal.
Overview
DORA is a research program for studying the capabilities that drive software delivery and operations performance. DORA helps teams apply these capabilities to improve organizational performance. For more information about DORA, see the DORA website.
DORA metrics are a set of key performance indicators (KPIs) that DORA has developed to measure the effectiveness of an organization’s DevOps practices. These metrics help organizations to assess their software development and delivery processes and identify areas for improvement.
Collecting DORA metrics can be challenging because it involves:
- Gathering data from various sources and tools
- Ensuring data accuracy and consistency
- Dealing with organizational and cultural resistance to measurement and improvement
Tanzu Application Platform is uniquely positioned to provide DORA metrics through its integrated supply chain. This supply chain offers end-to-end visibility and control over the entire development and deployment process, enabling comprehensive measurement and optimization of DevOps practices.
DORA metrics
DORA metrics include:
-
Deployment Frequency, which measures how often code changes are deployed to an environment. High deployment frequency is often associated with a mature DevOps culture.
-
Lead Time for Changes, which measures the time it takes to go from code committed to code successfully running in an environment. Shortening this lead time is often a goal of DevOps practices.
-
Change Failure Rate, which measures the rate at which changes to the production environment cause failures or incidents. Lower failure rates indicate a reliable software delivery process.
-
Mean Time to Recovery (MTTR), which measures how quickly an organization can recover from incidents or outages in production. A lower MTTR suggests that an organization resolves issues quickly.
Supported DORA metrics
This table shows supported DORA metrics in the Tanzu Application Platform v1.11.0 DORA plug-in. Support for more metrics is planned for later DORA plug-in versions.
| DORA metric | Tanzu Application Platform v1.11.0 DORA plug-in support |
|---|---|
| Deployment Frequency | Yes |
| Lead Time for Changes | Yes |
| Change Failure Rate | Yes |
| Mean Time to Recovery | No |
View the DORA metrics for a component
To view the DORA metrics for a component:
-
Select the component you want to view DORA metrics for.
-
Click the DORA tab in the navigation list.
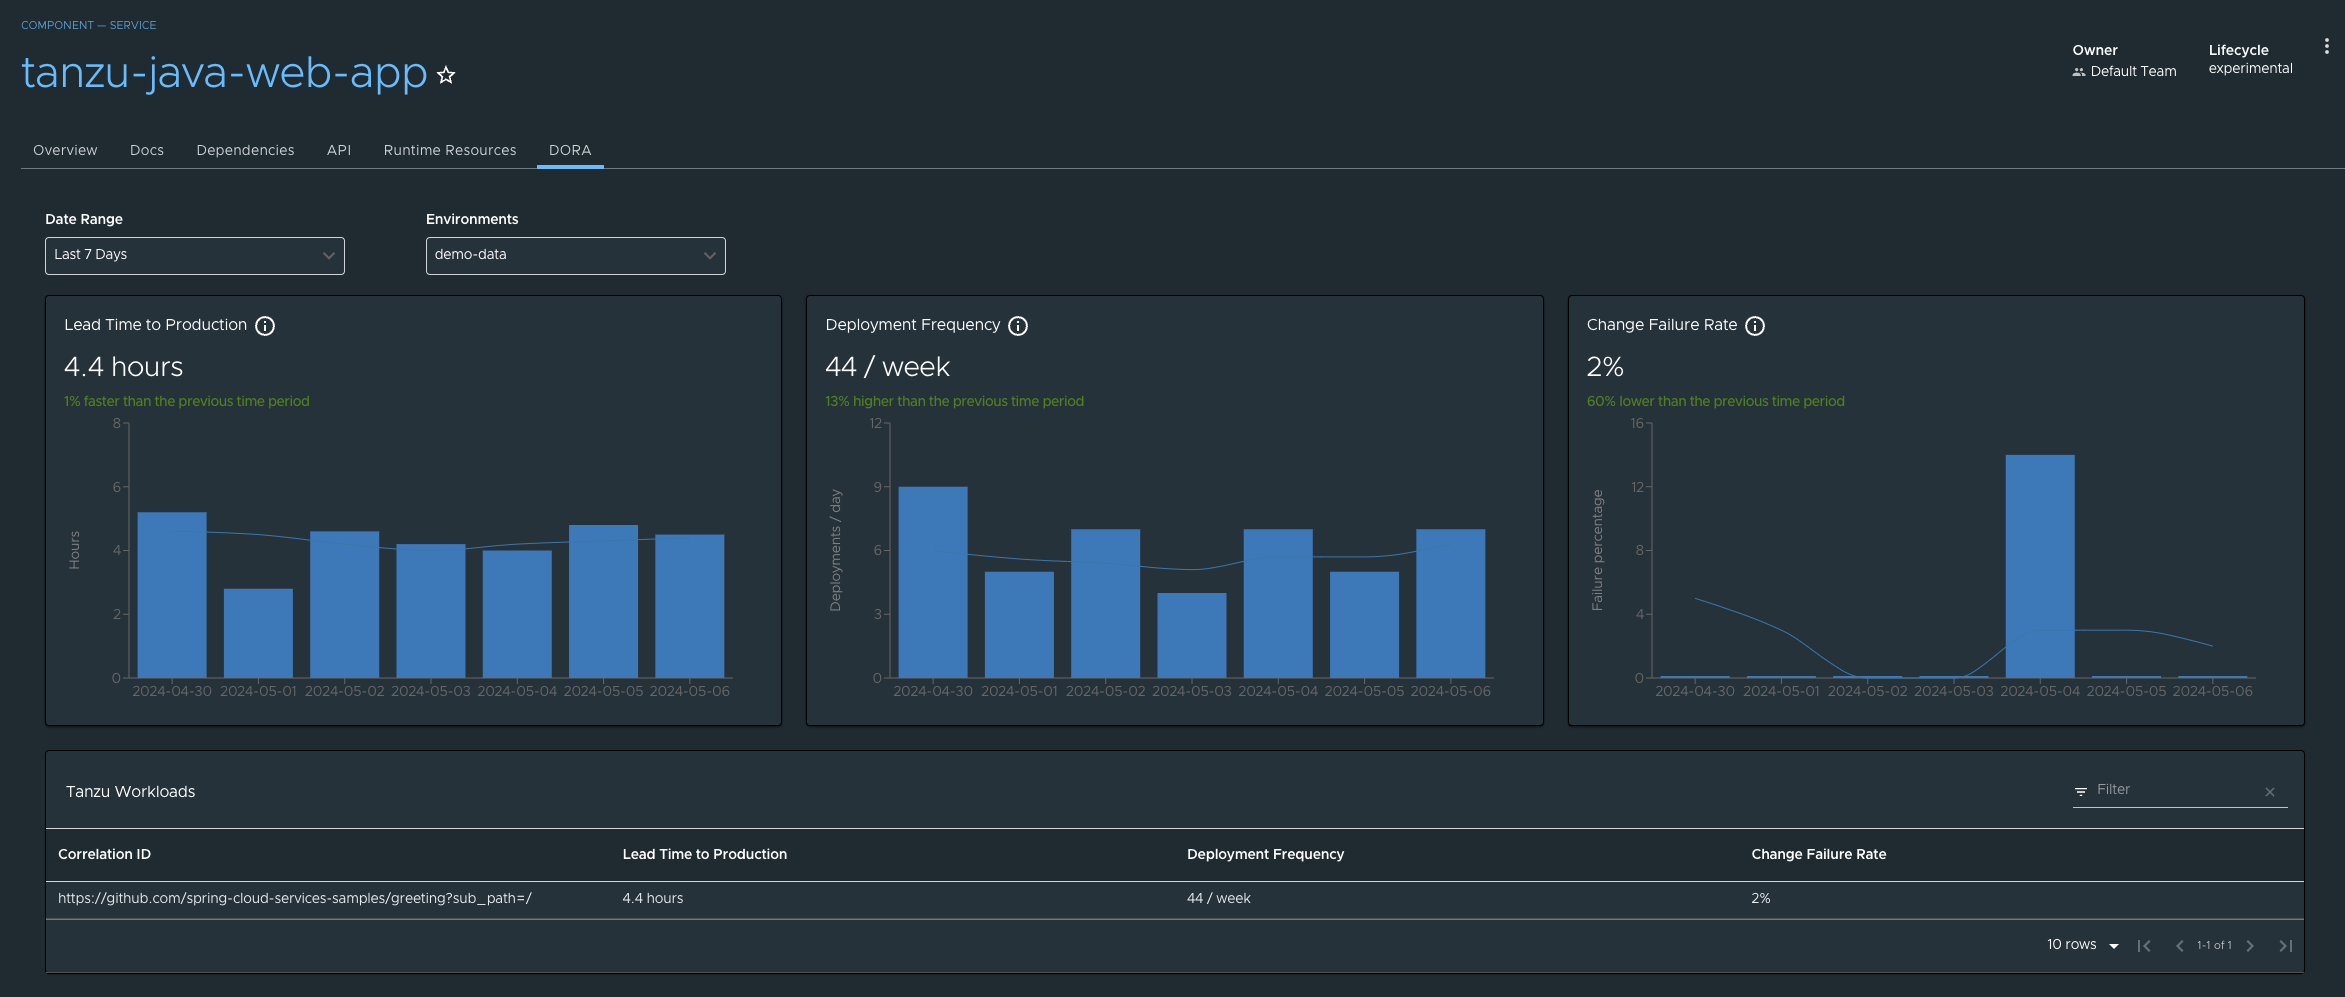
Filtering options
By default, DORA metrics are calculated from the average number of deployments to all environments in the last 7 days. Two filtering options are available from drop-down menus:
- By date range, based on a predefined set of choices
- By environment, based on the location labels configured by a platform engineer
For more information about location configuration, see Configure Artifact Metadata Repository.
There is an information tooltip for each metric that provides you with a brief description of that metric and how it is calculated. For more information about each calculation, see the DORA metrics calculations section later in the topic.
Historical graphs
DORA graphs display trends of each metric over time.
The Lead Time graph displays the average time taken for a code change to go from a commit to a running container in daily bars. The trend line illustrates the average lead time for deployments made in the last 7 days.
The Deployment Frequency graph displays the frequency of code changes deployed. The frequency is depicted in daily bars and a corresponding 7-day moving average trend line.
The Change Failure Rate graph displays the percentage of changes that failed to deploy successfully in daily bars. The trend line illustrates the average failure rate for deployments made in the last 7 days.
Tanzu workloads have a correlation ID that groups all the artifacts together. The Out of the Box (OOTB) supply chains automatically apply the "apps.tanzu.vmware.com/correlationid" annotation to all Kubernetes resources created with the workload’s correlation ID.
The default correlation ID is constructed from the source resource created from the workload. For example, the correlation ID for a workload that defines its source as a Git repository might look like "https://github.com/ORG-NAME/REPO-NAME?sub_path=SUB-PATH", where:
https://github.com/ORG-NAME/REPO-NAMEis the URL of the Git repository containing the source code for the workloadSUB-PATHis the path to the source code within the Git repository
Application operators can specify a custom correlation ID by setting the "apps.tanzu.vmware.com/correlationid" annotation on the workload to the desired string. This value is then propagated to all resources created by the supply chain.
DORA metrics calculations
For the Deployment Frequency metric, a deployment is considered to be the first time a pod is scheduled for each distinct image built from a code change. The metric is displayed in terms of deployments per week.
For the Lead Time metric, the lead time for a change is calculated as the period between when code is changed and the first time that a pod is scheduled for any image built from the change. The metric is displayed in the largest time unit that is a value of at least one.
For the Change Failure Rate metric, a failure is defined as 2 or more pod terminations detected for an image built from a code change within 10 minutes of the first time that a pod was scheduled to run that image. The metric is displayed as a percentage of the total number of deployments. A platform operator can configure the minimum number of terminations and the period of time during which terminations are included in the failure calculation.
DORA metrics configuration
This Tanzu Application Platform values file extract shows an example DORA metrics configuration beneath the dora key:
dora:
  changeFailureRate:
    terminationCount: 2
    terminationInterval: 10
The configuration options are:
| Property | Default Value | Description |
|---|---|---|
dora.changeFailureRate.terminationCount |
2 | The minimum number of pod terminations detected for a code-change to count as a failed deployment |
dora.changeFailureRate.terminationInterval |
10 | The period in minutes during which pod terminations are counted for determining whether a code-change deployment has failed |
