


Iterate on your new app using Tanzu Developer Tools for VS Code
This topic guides you through starting to iterate on your first application on Tanzu Application Platform (commonly known as TAP). You deployed the app in the previous how-to Deploy your first application.
What you will do
- Prepare to iterate on your application.
- Prepare your project to support Live Update.
- Prepare your IDE to iterate on your application.
- Apply your application to the cluster.
- Live update your application to view code changes updating live on the cluster.
- Debug your application.
- Monitor your running application on the Application Live View UI.
- Delete your application from the cluster.
Prepare to iterate on your application
In the previous Getting started how-to topic, Deploy your first application, you deployed your first application on Tanzu Application Platform. Now that you have developed a skeleton workload, you are ready to begin to iterate on your new application and test code changes on the cluster.
Tanzu Developer Tools for VS Code is VMware Tanzu’s official IDE extension for VS Code. It helps you develop and receive fast feedback on your workloads running on the Tanzu Application Platform.
The VS Code extension enables live updates of your application while running on the cluster and allows you to debug your application directly on the cluster. For information about installing the prerequisites and the Tanzu Developer Tools for VS Code extension, see Install Tanzu Developer Tools for your VS Code.
ImportantUse Tilt v0.30.12 or a later version for the sample application.
To prepare to iterate on your application, you must:
Prepare your project to support Live Update
Tanzu Live Update uses Tilt. This requires a suitable Tiltfile to exist at the root of your project. Both Gradle and Maven projects are supported, but each requires a Tiltfile specific to that type of project.
The Tanzu Java Web App accelerator allows you to choose between Maven and Gradle and includes a Tiltfile. If you used the accelerator, your project is already set up correctly.
To verify your project is set up correctly, review the following requirements depending on your chosen build system.
Maven Spring Boot project requirements
If you are using Maven, your Tiltfile must be similar to the following:
SOURCE_IMAGE = os.getenv("SOURCE_IMAGE", default='your-registry.io/project/tanzu-java-web-app-source')
LOCAL_PATH = os.getenv("LOCAL_PATH", default='.')
NAMESPACE = os.getenv("NAMESPACE", default='default')

k8s_custom_deploy(
    'tanzu-java-web-app',
    apply_cmd="tanzu apps workload apply -f config/workload.yaml --update-strategy replace --debug --live-update" +
               " --local-path " + LOCAL_PATH +
               " --source-image " + SOURCE_IMAGE +
               " --namespace " + NAMESPACE +
               " --yes --output yaml",
    delete_cmd="tanzu apps workload delete -f config/workload.yaml --namespace " + NAMESPACE + " --yes",
    container_selector='workload',
    deps=['pom.xml', './target/classes'],
    live_update=[
      sync('./target/classes', '/workspace/BOOT-INF/classes')
    ]
)

k8s_resource('tanzu-java-web-app', port_forwards=["8080:8080"],
            extra_pod_selectors=[{'carto.run/workload-name': 'tanzu-java-web-app', 'app.kubernetes.io/component': 'run'}])
Gradle Spring Boot project requirements
If you are using Gradle, review the following requirements:
-
The
Tiltfilelooks like a Maven Tiltfile except for some key differences in thedeps=andlive-update=sections:... deps=['build.gradle.kts', './bin/main'], live_update=[ sync('./bin/main', '/workspace/BOOT-INF/classes') ] ... -
The project must be built as an exploded JAR. This is not the default behavior for a Gradle-based build. For a typical Spring Boot Gradle project, you must deactivate the
jartask in thebuild.gradle.ktsfile as follows:... tasks.named<Jar>("jar") { enabled = false }
Set up the IDE
After verifying your project has the required Tiltfile and Maven or Gradle build support, you are ready to set up your development environment.
-
Open the Tanzu Java Web App as a project within your VS Code IDE by clicking File > Open Folder, select the Tanzu Java Web App folder and click Open.
If you don’t have the Tanzu Java Web App you can obtain it by following the instructions in Generate a new project using an Application Accelerator, or from the Application Accelerator Samples GitHub page.
-
To ensure that your extension assists you with iterating on the correct project, configure its settings as follows:
-
In Visual Studio Code, navigate to Preferences > Settings > Extensions > Tanzu Developer Tools.
-
In the Local Path text box, provide the path to the directory containing the Tanzu Java Web App. The current directory is the default.
The local path value tells the Tanzu Developer Tools for VS Code extension which directory on your local file system to bring into the source image. For example, dot (
.) uses the working directory, or you can specify a full file path. -
Customize the installation of Local Source Proxy.
If you don’t have Local Source Proxy configured, you can use the source image parameter instead. The source image value tells the Tanzu Developer Tools for VS Code extension where to publish the container image with your non-compiled source code, and what to name that image. The image must be published to a container image registry where you have write access. For example,
gcr.io/myteam/tanzu-java-web-app-source.Note
See the documentation for the registry you’re using to find out which steps are necessary to authenticate and gain push access.
For example, if you use Docker, see the Docker documentation, or if you use Harbor, see the Harbor documentation.
For troubleshooting failed registry authentication, see Troubleshoot using Tanzu Application Platform
-
-
Confirm that your current Kubernetes context has a namespace associated with it. The TANZU WORKLOADS section of the Explorer view in the left Side Bar uses the namespace associated with your current Kubernetes context to populate the workloads from the cluster.
-
Open the Terminal by clicking View > Terminal.
-
Ensure your current context has a default namespace by running:
kubectl config get-contextsThis command returns a list of all of your Kubernetes contexts with an asterisk (
*) in front of your current context. Verify that your current context has a namespace in the namespace column. -
If your current context does not have a namespace in the namespace column, run:
kubectl config set-context --current --namespace=YOUR-DEVELOPER-NAMESPACEWhere
YOUR-DEVELOPER-NAMESPACEis the namespace value you want to assign to your current Kubernetes context.
-
You are now ready to iterate on your application.
Apply your application to the cluster
Apply the workload to see your application running on the cluster by doing one of the following:
-
In the Explorer view in the left Side Bar, right-click any file under the application name
tanzu-java-web-appand click Tanzu: Apply Workload to begin applying the workload to the cluster. -
Alternatively, use the Command Palette, ⇧⌘P on Mac and Ctrl+Shift+P on Windows or View > Command Palette, to run the
Tanzu: Apply Workloadcommand.
The apply workload command runs, which opens a terminal and shows you the output of the workload apply.
You can also monitor your application as it’s being deployed to the cluster using the TANZU ACTIVITY tab in the Panel at the bottom of VS Code. The TANZU ACTIVITY tab shows the details of the Kubernetes resources for the workloads running in the namespace associated with your current Kubernetes context.
To view the TANZU ACTIVITY tab, open the Panel at the bottom of VS Code (View > Appearance > Panel) and then click the TANZU ACTIVITY tab. The apply workload command can take a few minutes to deploy your application onto the cluster. After complete, you can see the workload running in the TANZU WORKLOADS section of the Explorer view in the left Side Bar.
Enable Live Update for your application
Live Update allows you to save changes to your code and see those changes reflected within seconds in the workload running on the cluster.
To enable Live Update for your application:
-
To begin Live Updating the workload on the cluster, do one of the following:
-
In the Explorer view in the left Side Bar, right-click any file under the application name
tanzu-java-web-appand clickTanzu: Live Update Start. -
Right-click the
tanzu-java-web-appin the TANZU WORKLOADS section of the Explorer view and clickTanzu: Live Update Start. -
From the Command Palette, ⇧⌘P on Mac and Ctrl+Shift+P on Windows, type in and select
Tanzu: Live Update Start.
You can view output from Tanzu Application Platform indicating that the container is being built and deployed.
The status of Live Update is reflected in the TANZU WORKLOADS view under the
tanzu-java-web-appworkload entry. You can also seeLive Update starting...in the status bar at the bottom right. Live update can take up to three minutes while the workload deploys and the Knative service becomes available.Note
Depending on the type of cluster you use, you might see an error similar to the following:
ERROR: Stop! cluster-name might be production. If you're sure you want to deploy there, add: allow_k8s_contexts('cluster-name') to your Tiltfile. Otherwise, switch k8scontexts and restart Tilt.Follow the instructions and add the line,
allow_k8s_contexts('cluster-name')to yourTiltfile. -
-
When the Live Update status in the TANZU WORKLOADS view changes from
Live Update StoppedtoLive Update Running, navigate tohttp://localhost:8080in your browser to view your running application. -
In the IDE, make a change to the source code. For example, in
HelloController.java, edit the string returned to sayHello!, and save. -
The container is updated when the logs stop streaming. Go to your browser and refresh the page.
-
View the changes to the workload running on the cluster.
-
Either continue making changes, or stop the Live Update process when finished. To stop Live Update, open the Terminal by navigating to View > Terminal, and click the trash can icon that appears when you place your hover over the tilt: up - tanzu-java-web-app process, or select the process and use hot key ⌘+Backspace.
Debug your application
Debug your application in a production-like environment by debugging on your Kubernetes cluster.
To debug the cluster:
-
Set a breakpoint in your code. For example, in
HelloController.java, set a breakpoint on the line returning text. -
Open the Panel at the bottom of VS Code by clicking View > Appearance > Panel.
-
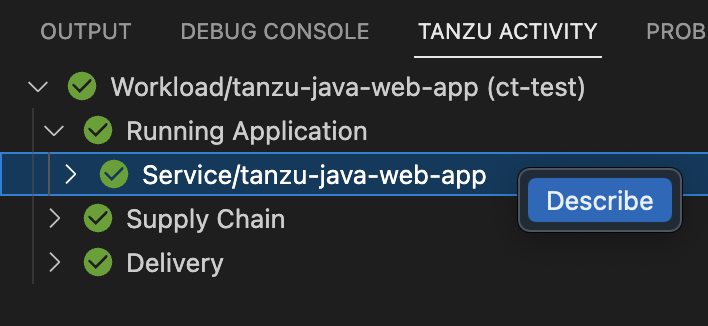
In the Panel, click the TANZU ACTIVITY tab.
-
In the TANZU ACTIVITY tab, go to Workload/tanzu-java-web-app > Running Application > Service/tanzu-java-web-app.
-
Right-click the Pod… entry and select Describe.
-
In resulting output, copy the value after Status > URL: that begins with
https://tanzu-java-web-app.... Make sure you copy the value from Status > URL: and not the value under Status > Address > URL.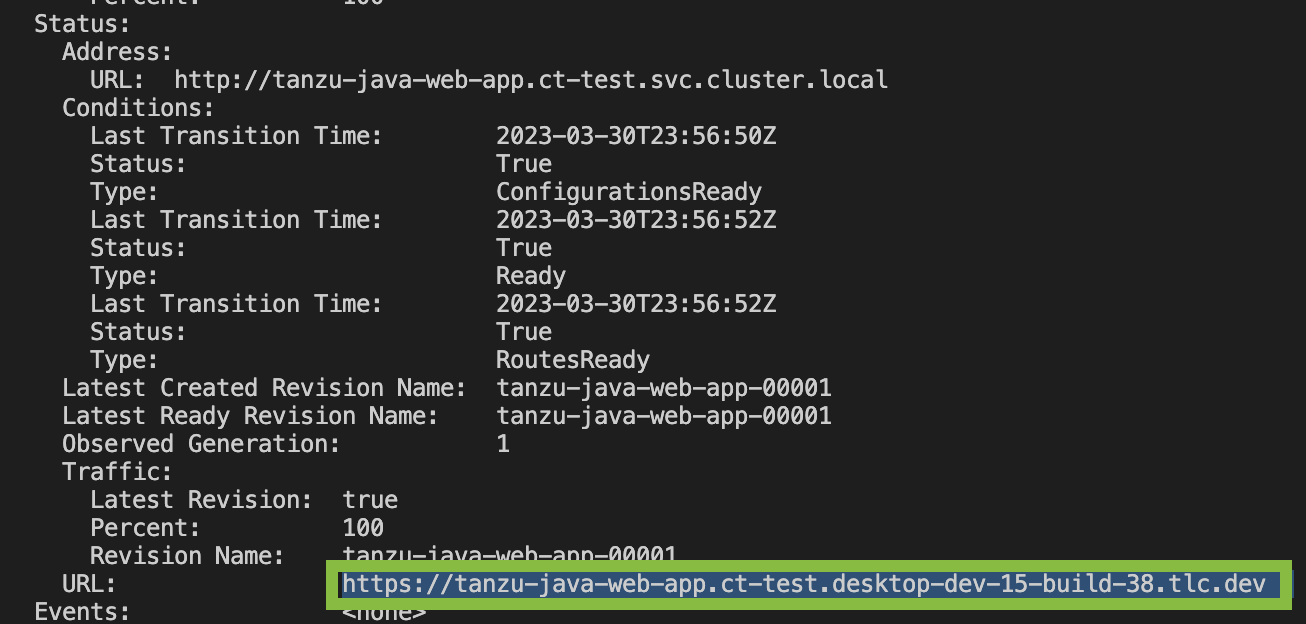
-
Open your web browser and paste the URL you copied to access your workload.
-
Begin debugging the workload on the cluster by doing one of the following:
-
In the Explorer view in the left Side Bar, right-click any file under the application name
tanzu-java-web-appand click Tanzu: Java Debug Start. -
Alternatively, right-click the
tanzu-java-web-appin the TANZU WORKLOADS view and click Tanzu: Java Debug Start.
-
-
In a few moments, debugging is enabled on the workload. The Deploy and Connect task completes and the debug actions are made available to you in the debug overlay, indicating that the debugger has attached.
The TANZU WORKLOADS view shows Debug Running under the
tanzu-java-web-appworkload. -
In your web browser, reload your workload. VS Code opens to show your breakpoint.
-
You can now continue the program, or stop debugging, using the debug controls overlay.
Monitor your running application
Inspect the runtime characteristics of your running application using the Application Live View UI to monitor:
- Resource consumption
- Java Virtual Machine (JVM) status
- Incoming traffic
- Change log level
You can also troubleshoot environment variables and fine-tune the running application.
Use the following steps to diagnose Spring Boot-based applications by using Application Live View:
-
Confirm that the Application Live View components are installed. For instructions, see Install Application Live View.
-
Access the Application Live View UI plug-in in Tanzu Developer Portal. For instructions, see Entry point to Application Live View plug-in.
-
Select your running application to view the diagnostic options and inside the application. For more information, see Application Live View features.
Delete your application from the cluster
You can use the delete action to remove your application from the cluster by doing one of the following:
-
In the Explorer view in the left Side Bar, right-click any file under the application name
tanzu-java-web-appand click Tanzu: Delete Workload to delete the workload from the cluster. -
Alternatively, right-click the
tanzu-java-web-appin the TANZU WORKLOADS view and click Tanzu: Delete Workload.
Next steps
