DORA metrics in Tanzu Developer Portal
This topic tells you about viewing DevOps Research and Assessment (DORA) metrics in Tanzu Developer Portal.
Overview
DORA is a research program for studying the capabilities that drive software delivery and operations performance. DORA helps teams apply these capabilities to improve organizational performance. For more information about DORA, see the DORA website.
DORA metrics are a set of key performance indicators (KPIs) that DORA has developed to measure the effectiveness of an organization’s DevOps practices. These metrics help organizations to assess their software development and delivery processes and identify areas for improvement.
Collecting DORA metrics can be challenging because it involves:
- Gathering data from various sources and tools
- Ensuring data accuracy and consistency
- Dealing with organizational and cultural resistance to measurement and improvement
Tanzu Application Platform is uniquely positioned to provide DORA metrics through its integrated supply chain. This supply chain offers end-to-end visibility and control over the entire development and deployment process, enabling comprehensive measurement and optimization of DevOps practices.
DORA metrics
DORA metrics include:
-
Deployment Frequency, which measures how often code changes are deployed to an environment. High deployment frequency is often associated with a mature DevOps culture.
-
Lead Time for Changes, which measures the time it takes to go from code committed to code successfully running in an environment. Shortening this lead time is often a goal of DevOps practices.
-
Change Failure Rate, which measures the rate at which changes to the production environment cause failures or incidents. Lower failure rates indicate a reliable software delivery process.
-
Mean Time to Recovery (MTTR), which measures how quickly an organization can recover from incidents or outages in production. A lower MTTR suggests that an organization resolves issues quickly.
Supported DORA metrics
This table shows supported DORA metrics in the Tanzu Application Platform v1.7.11 DORA plug-in. Support for more metrics is planned for later DORA plug-in versions.
| DORA metric | Tanzu Application Platform v1.7.11 DORA plug-in support |
|---|---|
| Deployment Frequency | Yes |
| Lead Time for Changes | Yes |
| Change Failure Rate | No |
| Mean Time to Recovery | No |
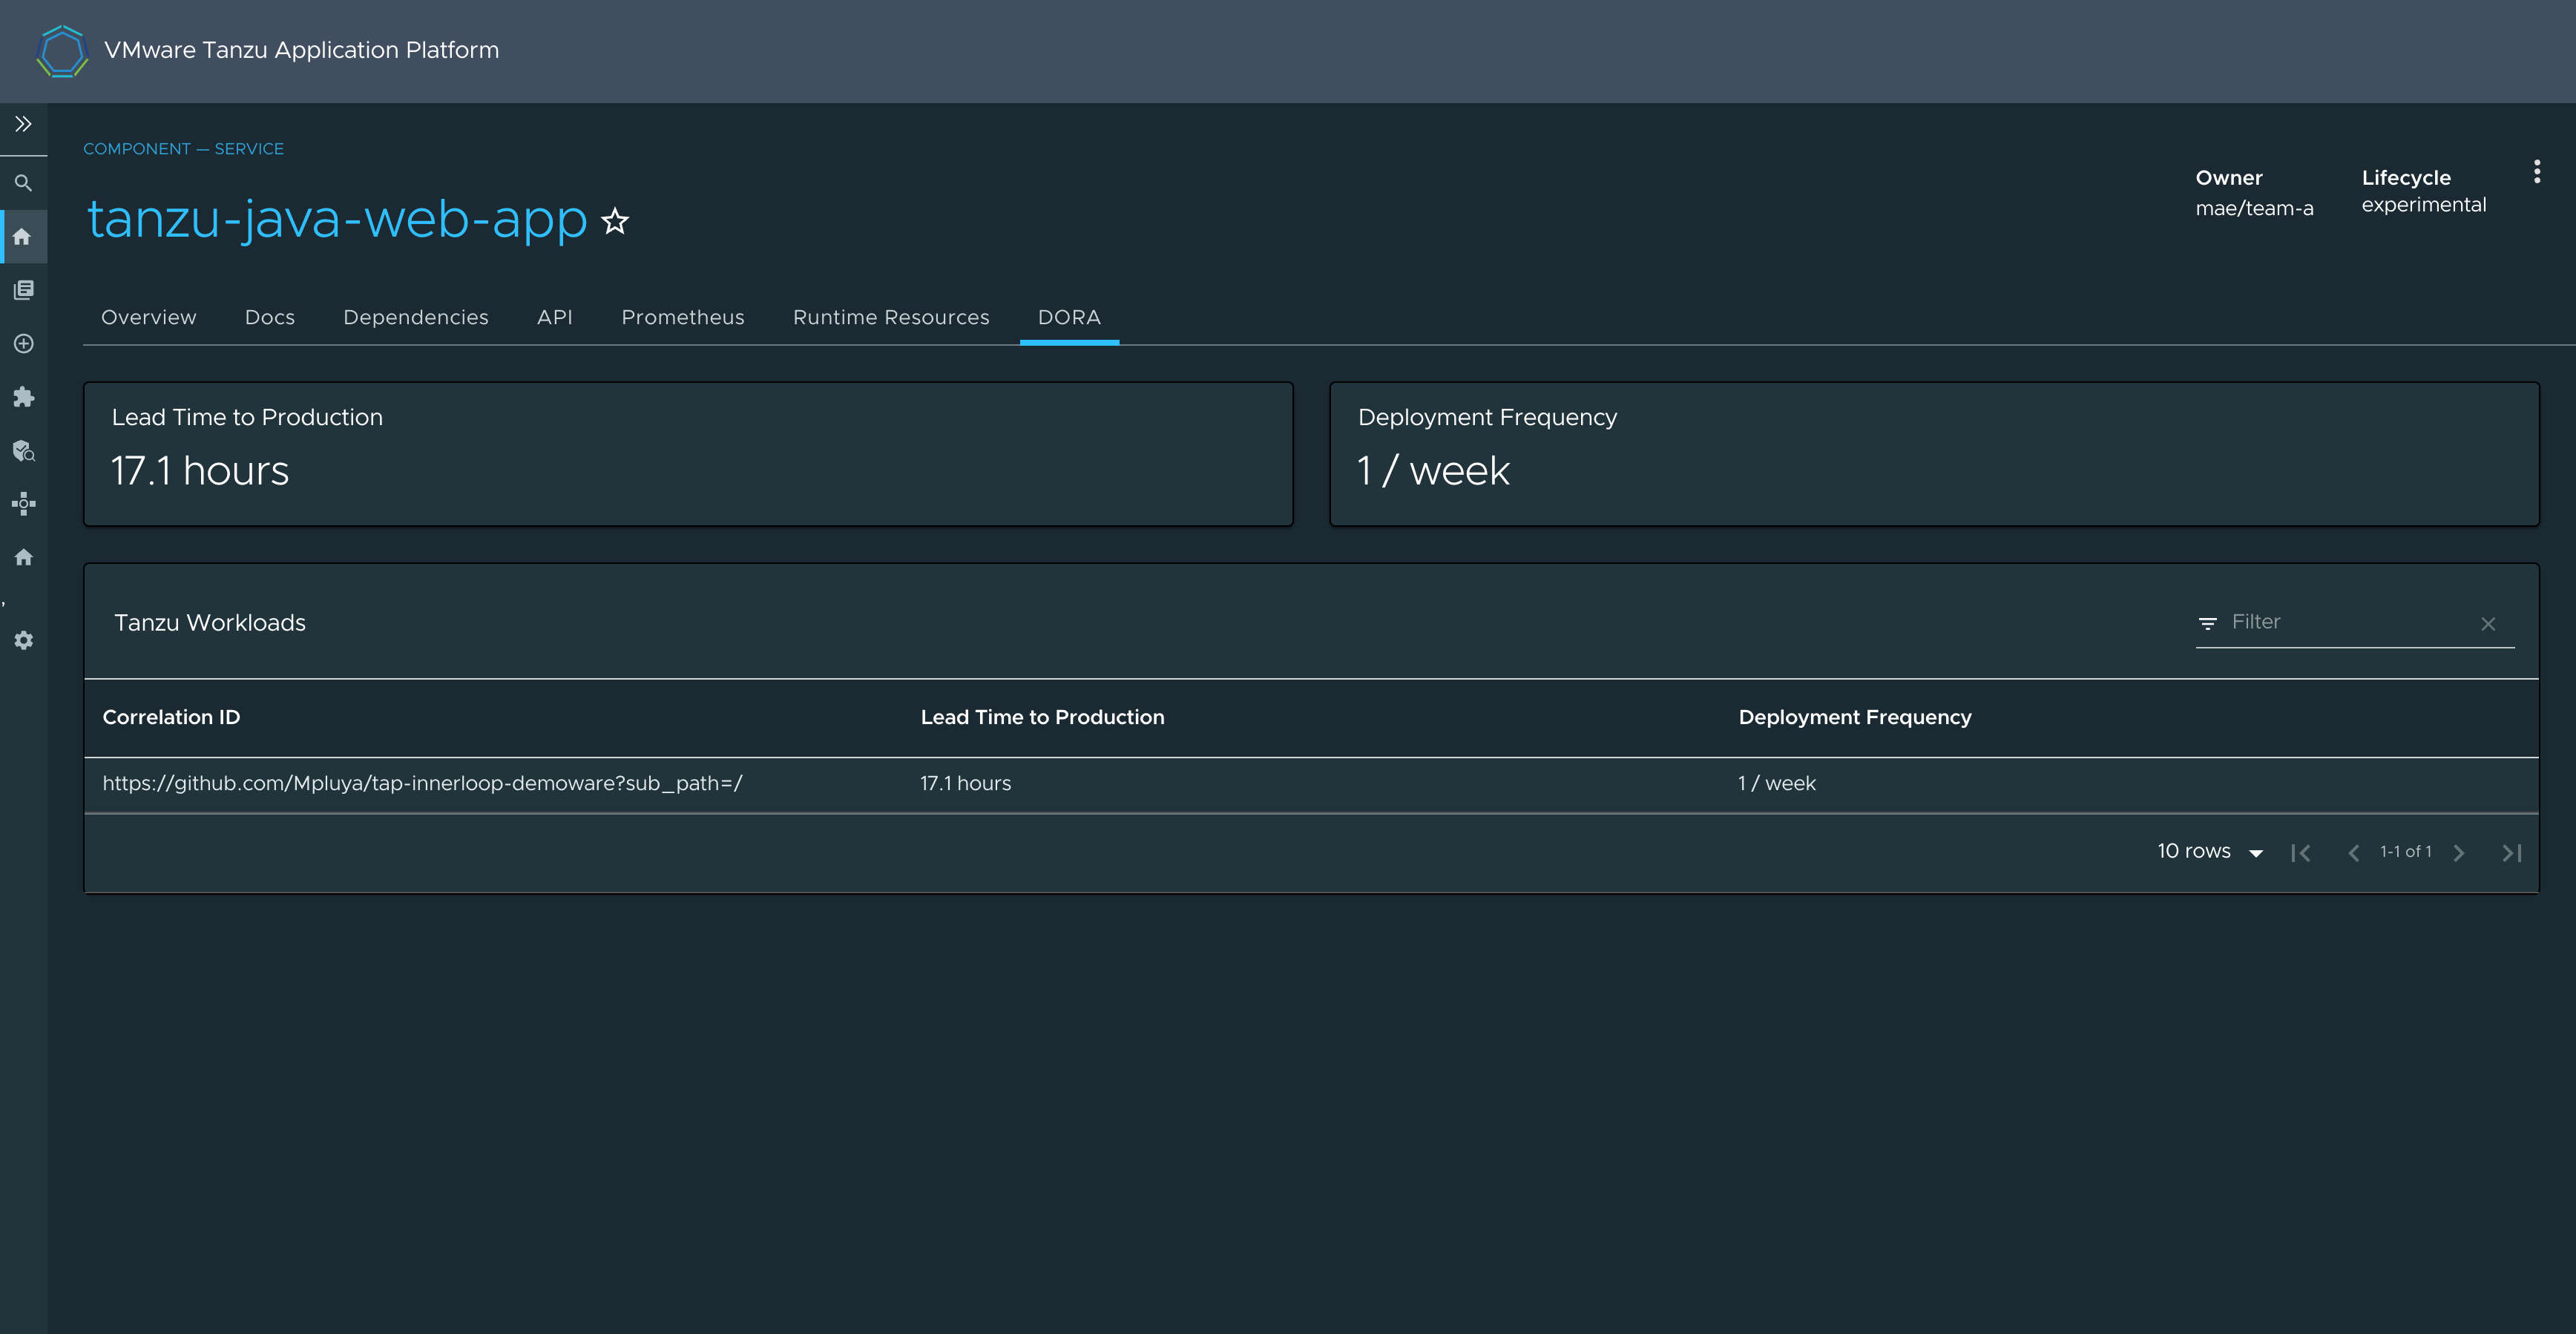
Use the DORA plug-in
To use the DORA plug-in:
-
Use an authentication provider to log in to Tanzu Developer Portal. You cannot see DORA metrics if you use guest access.
-
Select the component you want to view DORA metrics for.
-
Click the DORA tab in the navigation list.
DORA metric calculation
DORA metrics are calculated from the average number of deployments over the last 90 days.
Tanzu workloads have a correlation ID that groups all of the artifacts together. The Observer sends this information to the CloudEvent Handler to store DoraMetricsPerCorrelationID. For more information about the data model for DORA metrics, see Artifact Metadata Repository (AMR) data model and concepts.