


This topic tells you about the Metric Registrar for VMware Tanzu Application Service for VMs (TAS for VMs), which lets you define and use your own custom app metrics.
You can activate and configure the Metric Registrar from the TAS for VMs tile.
App metrics include custom app metrics that you can export with Metric Registrar, plus container metrics that are emitted by all TAS for VMs containers. For information about container metrics, see Container metrics.
Metric Registrar allows you to export custom app metrics in a format that Loggregator can consume. You can use the custom metrics to monitor apps with App Metrics and configure autoscaling rules with App Autoscaler.
If you are an App developer, you can export custom metrics to Loggregator by configuring your apps in one of the following ways:
-
Metrics Endpoint: Publish and register a Prometheus Exposition metrics endpoint to an app. The Metric Registrar then polls this endpoint every 35 seconds and convert the metrics found in the response to Loggregator metrics.
-
Structured Log: Modify your app to emit metrics using a specific JSON or DogStatsD format. The Metric Registrar then converts all matching log messages into Loggregator metrics or events.
For more information about installing the Metric Registrar plug-in and registering your app, see Emitting custom App Metrics to Metric Registrar.
For more information about the components and products mentioned, see:
Architecture
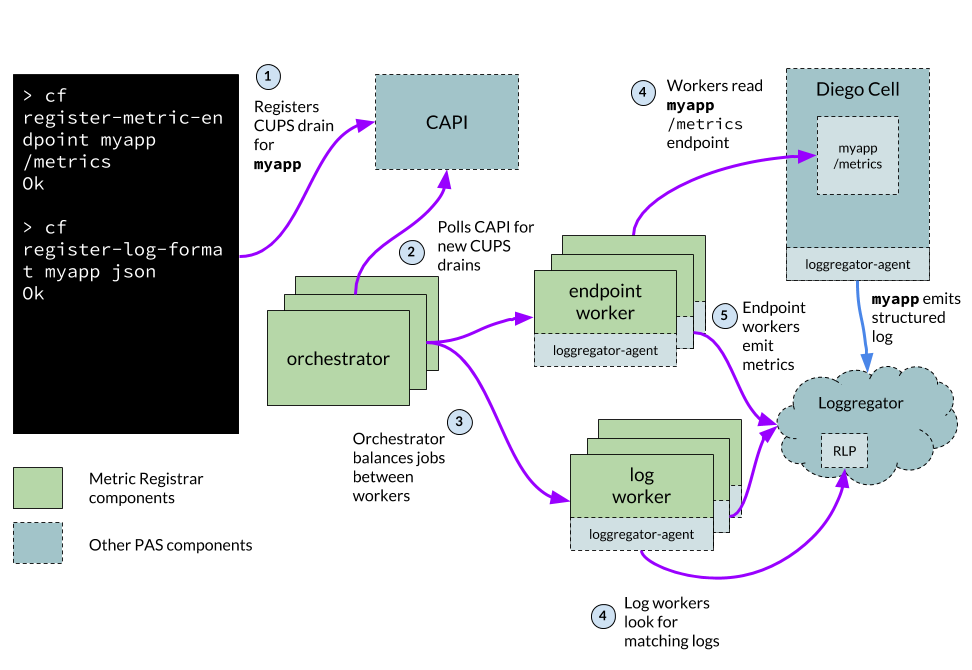
The following diagram illustrates how the Metric Registrar sends your custom app metrics to Loggregator. The components of the Metric Registrar are:
-
The cf CLI plugin
-
The
metric_registrar_endpoint_workerandmetric_registrar_log_workerjobs running on the Doppler VM of the TAS for VMs deployment -
The
metric_registrar_orchestratorandmetric_registrar_smoke_testjobs running on the Clock Global VM of the TAS for VMs deployment
Click the image for a larger representation.
Configuring Metric Registrar
The Metric Registrar is bundled with TAS for VMs, and you configure it in the TAS for VMs tile. You do not install and configure Metric Registrar as a separate product tile.
In the Metric Registrar pane, you configure the Metric Registrar. The Metric Registrar allows TAS for VMs to convert structured logs into metrics. It also scrapes metrics endpoints and forwards the metrics to Loggregator.
If you configure the Metric Registrar, VMware recommends that you also run the Metric Registrar smoke test errand. For more information, see Configure smoke tests.
Deactivate the Metric Registrar
By default, the Metric Registrar is deployed.
To deactivate the Metric Registrar:
-
Select Metric Registrar.
-
Clear the Enable Metric Registrar check box.
-
Click Save.
Edit default scraping interval
The scraping interval defines how often the Metric Registrar polls custom metric endpoints. The default is 35 seconds.
To edit the Metric Registrar scraping interval:
-
Select Metric Registrar.
-
Edit the Endpoint scraping interval field.
-
Click Save.
Add blocked tags
To prevent the Metric Registrar from consuming the value of a metric or event tag, you can add the tag to the Blocked tags field. For example, if you tag your metrics with a customer_id, you may want to add customer_id to the list of blocked tags.
By default, the following tags are blocked to prevent interference with other products like App Metrics that use and rely on such tags.
deploymentjobindexid
To prevent the Metric Registrar from consuming the value of a metric or event tag:
-
Select Metric Registrar.
-
Add the desired tags to the Blocked tags field in a comma-separated list.
-
Click Save.
Edit app instance metrics limit per scraping interval
The App instance metrics limit per scraping interval field defines how many metrics are emitted per app instance per interval. If the number of metrics an app instance generates within a scraping interval exceeds the configured limit, no metrics are emitted. Each individual Prometheus value is counted as one metric, including multiple values within the same metric family. By default, there is no limit.
To configure a metrics limit per scraping interval for app instances:
-
Select Metric Registrar.
-
Edit the App instance metrics limit per scraping interval field.
-
Click Save.
