


Machine Learning Powered Forecasting
Forecasting involves predicting future spending by analyzing historical spending and evaluating future plans. The Tanzu CloudHealth Forecasting feature powered by machine learning (ML) allows forecasting costs from the current month up to the next 36 months (about 3 years) with the ability to choose historical data from the past 12 months. The suite of ML algorithms is trained on multiple parameters and considers periodicity and seasonality to provide reasonably accurate forecasting. Additionally, the feature also considers how the changes in your cloud infrastructure and application lifecycle may affect your budgets and influence your future cloud investment decisions.
Importance and Benefits of Tanzu CloudHealth Forecasting
- Integrated ML model for improved accuracy in forecasting cost for your AWS, Azure, and GCP environment
- Visualize and compare multiple forecasts in one place with hands-on simulation and a budget threshold.
- Long-term and short-term forecasting
- Use multiple filters and Growth Factor to customize forecasting as per the business requirements
- Customize forecasting as per the business requirements
- Forecasted cost and planned budget comparison, with a focus on the budget deficit
- Save your Forecasting configurations for future reference and adopt as a budget.
Using the Forecasting Dashboard
To get started with ML-powered forecasting, go to Governance > Forecasting.
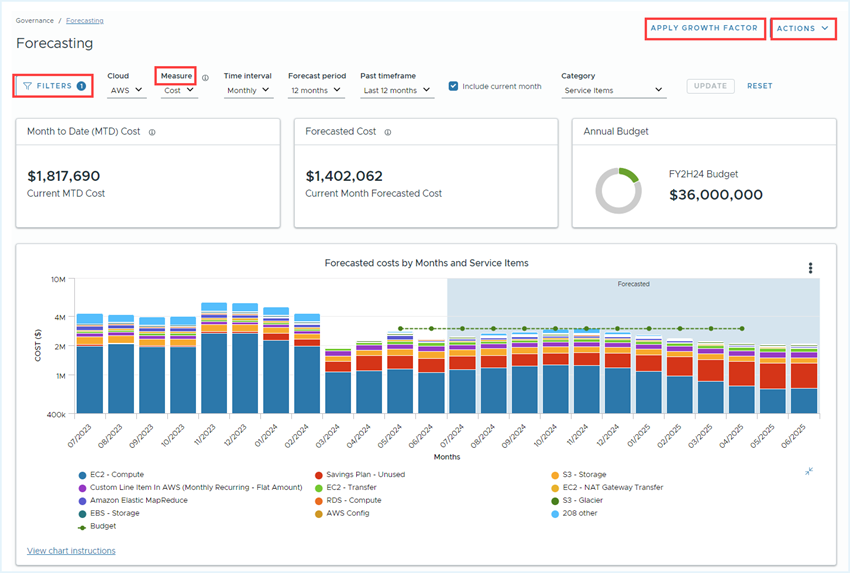
The summary widgets on the Forecasting dashboard provides the following information:
- Current Month to Date (MTD) Cost – Displays spending from the first day of the month up to today’s date.
- Current Month Forecasted Cost – Your expected spending for this month’s end as of today’s spending.
- Annual Budget – Displays the total budget value and progress of the budget. The chart displays utilized budget and available allocated budget percentage values.
The data grid below the chart provides a detailed view of your Actual and Forecasted cost data. It is divided into three sections.
- The fixed column on the left provides your current Category selection.
- In the middle scrollable pane, you can view the Actual and Forecasted data for the selected category, along with the Growth Factor percentage.
- The fixed column on the right provides the Total Forecast value for each line item.
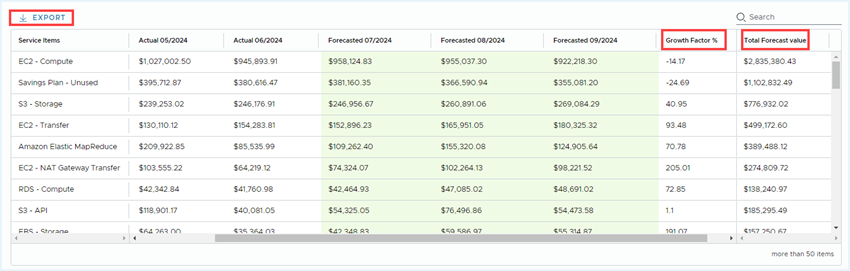
Note- Using the Export option, you can download the Forecasting details in CSV format and view the Total Actual spend based on your Forecasting Time interval (monthly/weekly/daily) setting.

Forecasting Settings
This section explores different options available to customize the Forecasting based on your needs. After selecting required options, click Update. You can see the values in the graph and the data grid change as per the selected criteria.
Filter Options
Use the following Filter options for more specific Forecasting cost data within a certain time frame in a category.
- Perspective
- Perspective Group – You can select multiple perspective groups.
- Budget – Select an existing budget or create a new budget. The drop-down menu displays Categorized budgets based on the selected Perspective.
- Growth Factor – Enter growth rate for ML to consider when forecasting the cost data.
- Billing accounts
- Accounts
- Services
- Regions
- Chart Type
- X axis - By default, Months
- Y axis – By default, Cost ($)
Cloud and Category Options
The following table lists the available Cloud and respective Category options for data forecasting.
| Cloud | AWS | Azure | GCP |
|---|---|---|---|
| Category options |
- Accounts - AWS Services - Service Items - Perspective - Region |
- Subscriptions - Services - Service Categories - Perspective - Zones |
- Projects - Cloud Products - Product Categories - Perspective - Regions |
Forecast Measure Options
Get deeper insights into your forecast cost with the following two Forecasting measures -
- Effective Cost - Refers to the cost that includes Actual Usage Cost based on the listed on-demand price and Amortized cost, excluding Prepays during the selected period.
- Cost - Refers to the cost that includes Actual Usage Cost based on the listed on-demand price, Reallocated cost, and chargeback cost.
Time Interval Options
The following table provides you information on the different Time interval options available for data forecasting. Based on your selected timeframe, you can select Forecast period and Past Timeframe.
- Forecast Period - The range for which the Tanzu CloudHealth will generate the forecast.
- Past Timeframe - The historical data Tanzu CloudHealth will use to generate the forecast for the selected Forecast period.
| Time Interval | Forecast Period | Past Timeframe |
|---|---|---|
| Monthly | By default, the next 12 Months. The available time range is from the next 1 month to 36 months (about 3 years). | By default, the last 12 months. The available time range is from the last 1 month to 12 months. |
| Weekly | By default, the next 52 Weeks. The available time range is from the next 1 week to the 104 weeks (about 2 years). | By default, the last 52 weeks (about 12 months). The available time range is from the last 1 week to 52 weeks. |
| Daily | By default, the next 62 days (about 2 months). The available time range is from the next 1 day to 124 days (about 4 months). | By default, the last 62 days (about 2 months). The available time range is from the last 1 day to 62 days. |
Apply Growth Factor
You can apply Growth Factor to AWS Accounts, Perspective, and Services, Azure Subscriptions and Services, and GCP cloud products category and Projects. For more information see What is Growth Factor?
How to Use Budget in Forecasting Cost Data?
Based on the historical data, you can compare the budgeted cost against your actual or forecasted cost for a given period. From the Filters pane, select the required budget from the list of existing budgets, and click Apply. The budget information appears on the Annual Budget widget.
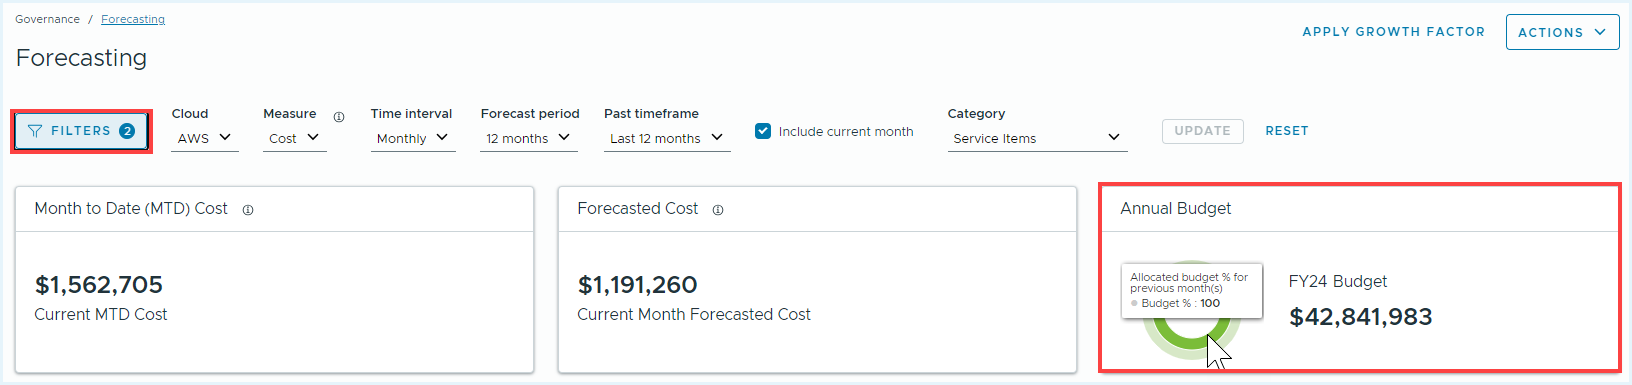
The Annual Budget widget shows the overall budget you plan to spend across your organization once a budget is selected.
Note that, in Forecasting > Filters, based on your Perspective selection, the Budgets dropdown also displays the Categorized budgets option.

The chart displays the actual vs budget and budget vs forecast information with a dotted line. Hover over a data point to view the values for the given time period.
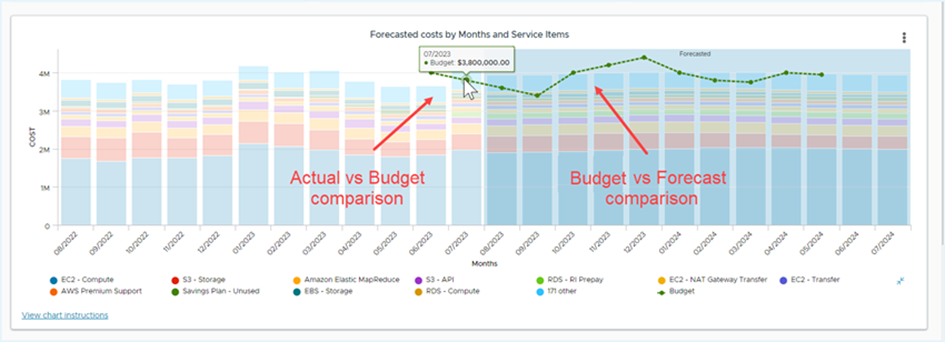
For more information on budgets, see Configure Budgets in Tanzu CloudHealth topic.
Create Forecasting Snapshot
Tanzu CloudHealth allows you to save the exact Forecasting configurations to compare and analyze the Forecasting data in different scenarios. You can save the exact forecast of a specific day for the selected criteria and compare up to three forecast configurations in a single window. The forecasted values in the Snapshot will remain unchanged in the future.
Snapshot Forecast enables you to
- Save your forecasting configuration to understand spend and match commitments
- Save multiple AWS, Azure, and GCP cloud forecast configurations for your business analysis
- Save the forecasting configuration as a future reference and adopt it as a budget
- Compare with actual values in the future and understand the multiple factors impacting future spend and accuracy
- Simulate forecasts post adopting one-time purchases or optimizations
- Compare forecasts for the same configurations with a single change
- Compare forecasts along with budgets to simulate and plan your
spendbetter - Save forecast to test the accuracy of the algorithms
Saving Forecasting Configuration
To save your Forecasting configuration,
- On the Forecasting page, click the Actions dropdown menu and select Save Snapshot.
- Provide a Name for your Forecasting configuration and add a Description.
- From the Who can view dropdown, select whether you want to share your Forecasting configurations with others.
- Click Save.
Note that the Budget selection in your Forecasting configuration is not automatically saved when you create a Save Snapshot.
Viewing Saved Snapshots
To access your saved Snapshots,
- On the Forecasting page, click the Actions dropdown menu, and select View Saved Snapshots. The Saved Snapshot page appears with all the Forecasting configurations that you have saved with the details such as Name, Cloud, Category, Forecast Period, Past Timeframe, Time interval, Created by, and Creation Date.
- Click the saved Snapshot you want to view. The saved Snapshot configuration appears on the screen. Note that you cannot modify the configurations in your saved Snapshots. However, you can analyze them using the Budget and Chart Type options in the Filters section.

Comparing multiple forecasts
NoteCompare Forecast Snapshots only with matching Time Interval.
To compare multiple forecasts,
- On the Saved Snapshots page, select the Forecasting configurations you want to compare, and click Compare. You can select up to three Saved Snapshots.
- In the Compare Forecasts window, the Total Cost chart displays the trend of selected Saved Snapshots.
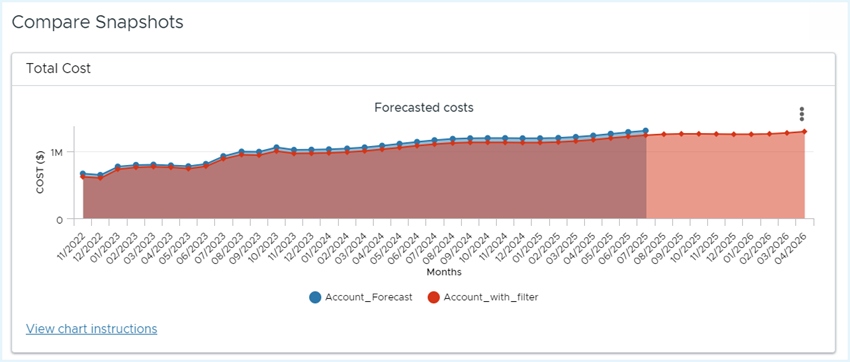
- (Optional) Click the three-dot menu to download the chart as a PNG or SVG file.
- The Input parameters for Forecast table displays the configuration details of the selected Saved Snapshots.

The table view allows for easy comparison of details such as the forecast period, the selected filters for perspective, and accounts, etc. - Click Cancel to go back to the Snapshot Forecast page.
What is Growth Factor? How to use it?
The Growth Factor is a user provided rate that Machine Learning models consider to forecast future costs. The Growth Factor lets you input a percent change to simulate forecasts based on your anticipated future expenses. You can set individual growth rates for each time series, and the overall growth rate is an accumulation of multiple growth rates.
With the help of Growth Factor:
- You can add percent change based on known or expected variances, giving flexibility not solely to rely on the historical data.
- You can simulate and compare results based on the input values, assisting in making informed decisions such as defining a budget.
- You can understand the portfolio’s spending trend in the future with expected variances.
To apply Growth Factor to your Forecasting configuration, go to Governance > Forecasting > Apply Growth Factor.
Types of Growth Factor
To suit your different business requirements, the Tanzu CloudHealth Forecasting feature is equipped with two types of Growth Factors.
- Standard – Apply a constant growth rate to your Forecasting configuration.
- Advanced – Apply custom growth rates to your Forecasting configuration for a specific Time period or to an AWS Service/Azure Service/ Product Categories or Account/Subscription/Project.
You have the flexibility to apply the Growth Factor for up to 12 months, 12 Quarters, or 3 years.
How to Apply Growth Factor
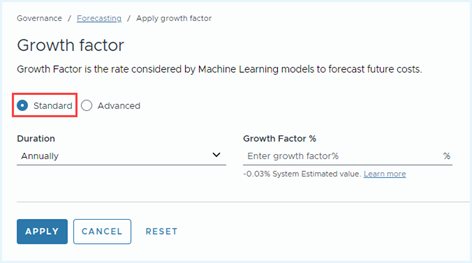
Standard Growth Factor
- On the Forecasting page, click Apply Growth Factor. The Standard Growth Factor type is selected by default.
-
Select the Duration for which you want to apply the growth rate. You can
- Customize your Forecasting configuration with a monthly growth rate for up to 12 months.
- Customize your Forecasting configuration with a quarterly growth rate for up to 12 Quarters.
- Customize your Forecasting configuration with a yearly growth rate for up to 3 years.
-
From the Growth Factor dropdown menu, choose the growth rate you want to apply for the selected duration. For reference, the System Estimated value is provided under the Growth Factor dropdown menu. It is the growth rate calculated by Tanzu CloudHealth ML algorithms.
- Click Apply.
Example – The current spend is $100, and if a user wants to set the Growth Factor at 10% for three years, then the Forecast will be -
- 1st year the cost will be $100*10% = $110
- 2nd year the cost will be $110*10% = $121
- 3rd year the cost will be $121*10% = $133.1
The growth rate of 10% will be applied each year.
Advanced Growth Factor
- On the Forecasting page, click Apply Growth Factor.
- Select the Advanced Growth Factor type.
- Select an option from the Apply Growth Factor to dropdown menu.
You can apply the Growth Factor to either a Time Period or a Category, such as a Service or an Account/Subscription, that you selected while configuring the Forecast.
Note – Currently, the Growth Factor is supported only at the AWS Services, Azure Service, and Product Categories level.

In the Advanced Growth Factor type, the following options are available for your Forecasting analysis.- Time Period – Select the Duration for which you want to apply the Growth Factor. You can
- Customize your Forecasting configuration with a monthly growth rate for up to 12 months.
- Customize your Forecasting configuration with a quarterly growth rate for up to 12 Quarters.
- Customize your Forecasting configuration with a yearly growth rate for up to 3 years.
- AWS Service/ Azure Service/ Product Categories - You can customize the growth rate of selected services for a specific Time Period. Select an AWS Service/ Azure Service/ Product Categories to which you want to apply the Growth Factor.
- Account/Subscription/Project - You can customize the growth rate of selected Accounts/ Subscriptions for a specific Time Period. Select the Accounts/Subscriptions/Project to which you want to apply the Growth Factor.
- Time Period – Select the Duration for which you want to apply the Growth Factor. You can
- Click Add Time Period to apply a growth rate to another Time Period or Category (Service or Account/Subscription).
