Use these steps to troubleshoot failures of workload clusters.
Problem
Workload clusters are not being provisioned.
Cause
Credentials may not be available.
Extensions are not healthy.
Status has not been accurately updated.
Provisioning is not completed, but still ongoing.
There could be issues with memory and CPU usage for the extensions.
There may be issues with the Kubernetes pods.
Note: The debug commands provided below are to be run in the management cluster.
Note: The supervisor registration process differs from vSphere 7.X and vSphere 7.Xu3.
Solution
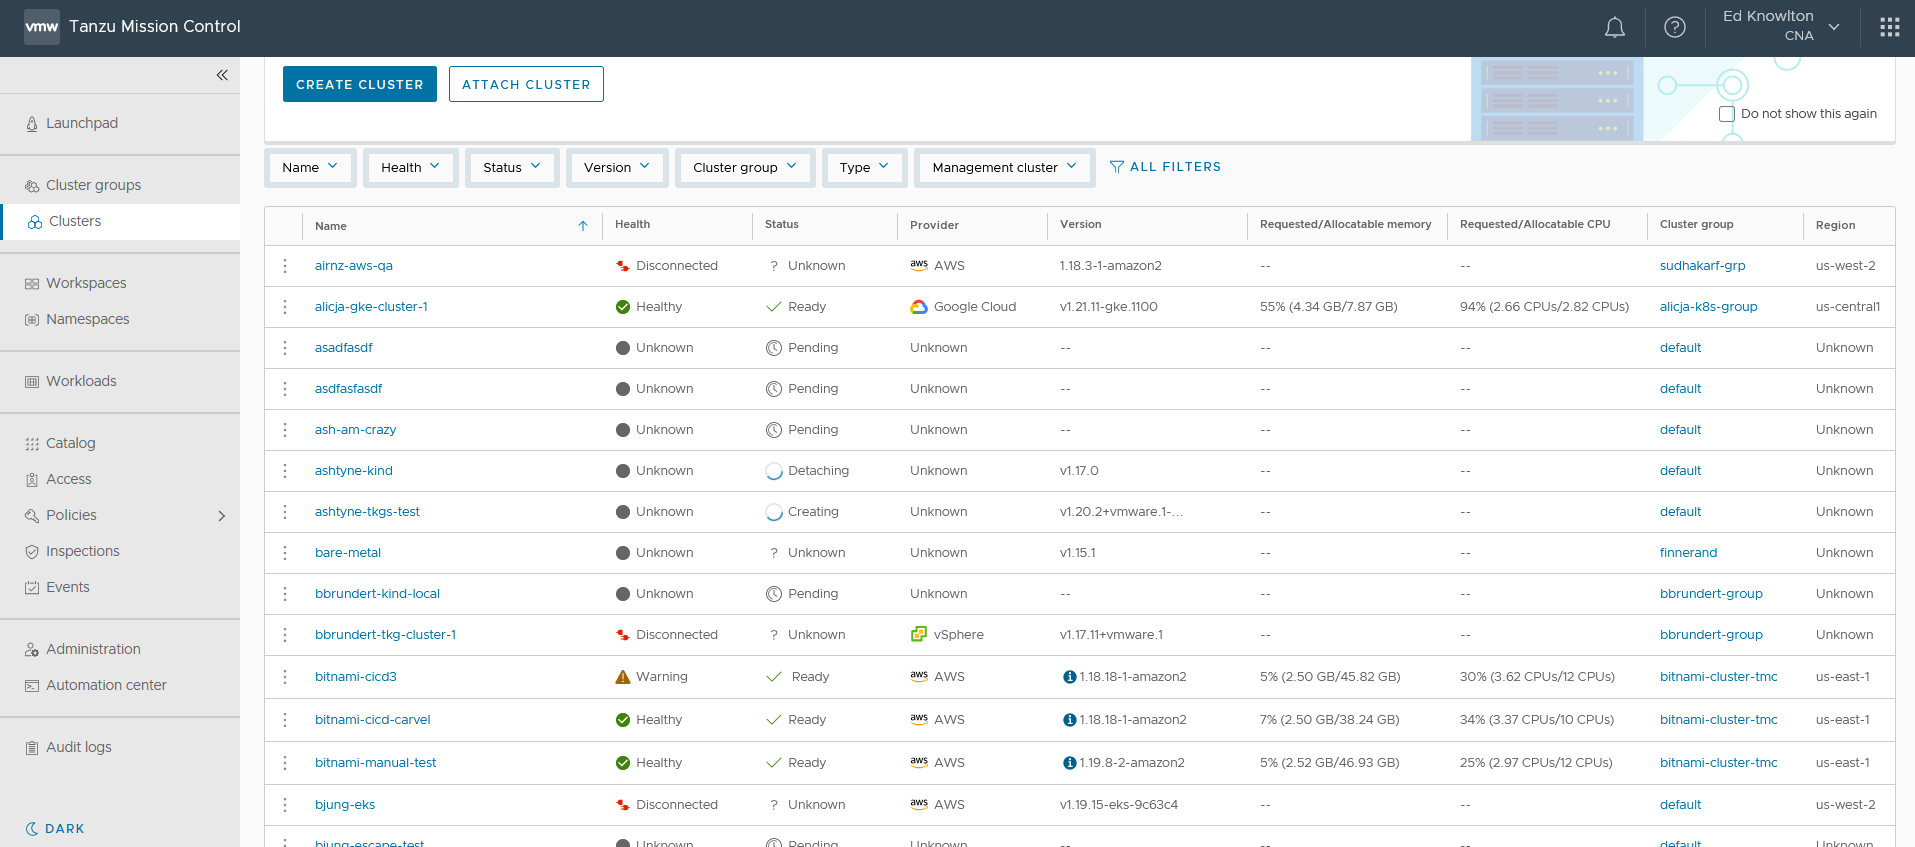
To view the status of a cluster, select Clusters.
Figure 1. Cluster Health
The status of the cluster is shown next to its name at the top of the screen. In addition to an Unhealthy status, if it says Unknown, that may indicate an issue as well because processes may still be running and may time out.
You can also see the health of the components, agents, and extensions on this screen. See Base Extensions below for a complete list of extensions.
Also, the component health for controller manager and scheduler are known to be blank for provisioned clusters. You can double check this on the Cluster details page.
Maybe the cluster came up, but the extensions might be unhealthy.
If the extensions are not showing as healthy, you can log in to the management cluster and check the status of the pods directly:
Check the Pods are not in an Error State. Are any pods failing to come up? Check the pod statuses with this command:
kubectl get pods -n vmware-system-tmc
Example failure statuses include: "CrashLoopBackOff," "CreateContainerError," and "Error."
If you see a pod that is failing to come up, check the logs for errors. First, export the name of the failing pod as an environment variable:
If the pod is in "CrashLoopBackOff" it means it is continually restarting, and you may need to wait for the next restart to capture the logs.
Base Extensions
agent-updater
cluster-auth-pinniped
cluster-health-extension
cluster-secret
extension-manager
extension-updater
gatekeeper-operator
inspection
intent-agent
package-deployment
policy-insight-extension
policy-sync-extension
sync-agent
tmc-observer
Restart deployments where pods have not come up successfully.
First, get the name of the deployment associated with the pod you want to restart.
Check all deployments in the namespace by running the following command and then do a safe restart of all pods in that deployment:
kubectl get deploy -n vmware-system-tmc
Export the deployment name as an environment variable.
export DEPLOYNAME=<deployment-name>
Restart all pods in the deployment:
kubectl rollout restart deploy/$DEPLOYNAME
At this stage, if the issue is not resolved, open a support ticket, making sure to include the full pod logs that you saved to a file earlier in step 2.d.
When creating a management cluster, you may see issues in the create screen. If they are errors that Tanzu Mission Control is aware of, for example, “AWS credentials not available” or “API Error: Failed to create cluster: management cluster or intent agent is not healthy (failed precondition),” these errors should have enough information to solve the issues. If not, collect the logs as described in step 2 above for including in a support ticket.
When creating a cluster and working in the Configure step, there might not be any Kubernetes versions listed, and it comes up as an empty drop down. This is because Tanzu Mission Control filters out the unsupported versions of Kubernetes, or because there are no images available to use in vSphere. Another example is Region, which might not support certain instance types. In this case you need to check your management cluster for issues.
In Chrome or Firefox, open the Network view in Inspect, and select Preserve Log to ensure that you capture responses as new requests come through, then, go through the steps in the create cluster wizard to see the full API responses returned.
Another option to using Network Inspect through the browser is to run the command kubectl get vsphereoptions options -n vmware-system-tmc -o yaml. The results of this command are what’s used to populate the Create Cluster page.
Note:
The example command given above is for vSphere specifically, and you must adjust it for other infrastructure providers as necessary.
To see a full list of all options CRDS for the various infrastructures run kubectl get crds -n vmware-system-tmc | grep -I option.
Once you have completed the Create page and click Create you get a message indicating that the cluster is being created, with a status bar.
Sometimes it may seem to be taking a long time to create or is failing to create. It does take some time, but you can view logs to see what is occurring using the following commands.
Sometimes during cluster creation there may be no obvious API error, and it may be reported as Ready when it is not. You can check the management cluster to see the actual status. To check the status of the cluster directly in the management cluster run:
kubectl get clusters -A
For further details on a particular cluster you can run:
kubectl describe cluster <cluster-name>
If the cluster is Ready in the management cluster but not showing as Ready in the administration console, this is an issue with the status being reported back to the cluster. You can try restarting the sync-agent and the cluster-agent pods and checking configurations to see where the failure to sync the status back is happening.
Different extensions might be installed based on the cloud service provider. You can check to confirm that the correct extensions are being installed for your platform.
Sometimes there is nothing wrong with the cluster, but status is not being sent back to Tanzu Mission Control and is not showing up or being updated. It could be a network communications issue. Check the cluster health extension, sync agent, and intent agent.
There might be issues with memory and CPU usage for the extensions. For information about memory and CPU usage, see Memory and CPU Usage by Cluster Agent Extensions in VMware Tanzu Mission Control Concepts.