

- Version 1.2
- Release Notes
- Overview
- Architecture
- Installing the Operator
- Upgrading the Operator
- Creating and Deleting Instances
- Updating Instances
- Upgrading Instances
- Accessing Instances
- Configuring High Availability
- Monitoring Instances
- Configuring TLS
- Rotating MySQL Credentials
- Connecting Applications
- Binding a TAS Application to a MySQL Instance
- Backing Up and Restoring MySQL Instances
- Property Reference for MySQL Resource
- Property Reference for Backup and Restore


This topic describes how to collect metrics and monitor VMware Tanzu™ SQL with MySQL for Kubernetes instances in a Kubernetes cluster.
Overview
Tanzu MySQL for Kubernetes uses the MySQL Server Exporter, a Prometheus exporter for MySQL server metrics. The Prometheus exporter provides an endpoint for Prometheus to scrape metrics from different application services. The MySQL Server Exporter shares metrics about the MySQL instances.
Upon initialization, each MySQL pod adds a MySQL server exporter container. Prometheus sends HTTPS requests to the exporter. The exporter queries the MySQL database and provides metrics in the Prometheus format on a /metrics https endpoint (port 9104) on the pod, conforming to the Prometheus HTTP API.
The diagram below shows the architecture of a single-node MySQL instance with MySQL server exporter, where the metrics are exported on port 9104:

Prometheus could be your primary consumer of the metrics, but any monitoring tool can take advantage of the /metrics endpoint.
Prerequisites
To take advantage of the metrics endpoint, ensure you have a metrics collector in your environment like Prometheus, or Wavefront. For an example installation of Prometheus, see Using Prometheus Operator to Scrape the Tanzu MySQL for Kubernetes Metrics.
Verifying MySQL Metrics
MySQL pods include the exporter that emits metrics by default. To test that the metrics are being emitted, you may use port forwarding (for more details see Use Port Forwarding to Access Applications in a Cluster in the Kubernetes documentation):
kubectl port-forward pod/<mysql-pod-name> 9104:9104
And then in another shell, use a tool like curl to run:
curl -k https://localhost:9104/metrics
The output shows the metrics collection, for example:
mysql_global_status_open_tables 165
For a list of the exposed Tanzu MySQL metrics collectors see MySQL Server Exporter Collector Flag Reference.
Using Prometheus Operator to Scrape the Tanzu MySQL for Kubernetes Metrics
Prometheus Operator allows you to define and manage monitoring instances as Kubernetes resources. This section provides an example of installing the Prometheus Operator using Helm, and a example Prometheus PodMonitor CRD that is used to scrape the MySQL metrics.
Use Helm to install the Prometheus Operator, that defines the custom resource definitions (CRDs) such as
PodMonitor. ThePodMonitorCRD defines the configuration details for the MySQL pod monitoring.helm install prometheus-community/kube-prometheus-stack \ --create-namespace \ --namespace=prometheus \ --set prometheus.service.port=80 \ --set prometheus.service.type=LoadBalancer \ --set grafana.enabled=false,alertmanager.enabled=false \ --set prometheus-node-exporter.hostRootFsMount=false \ --waitConfirm the PodMonitor CRD exists using:
kubectl get customresourcedefinitions.apiextensions.k8s.io podmonitors.monitoring.coreos.comCreate a
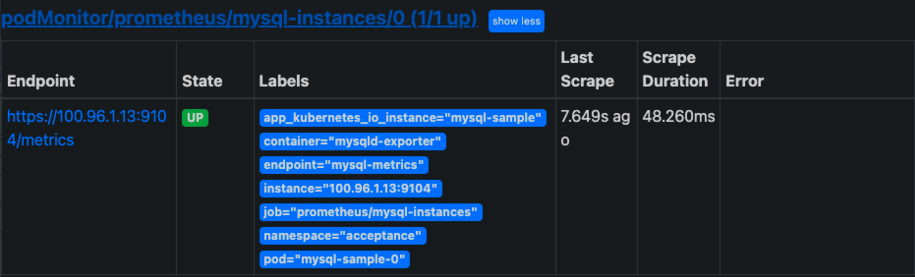
PodMonitorthat scrapes all MySQL instances every 10 seconds and skips verifying TLS:cat <<EOF | kubectl apply -f - --- apiVersion: monitoring.coreos.com/v1 kind: PodMonitor metadata: name: tanzu-mysql-instances namespace: prometheus spec: namespaceSelector: any: true selector: matchLabels: app.kubernetes.io/component: database app.kubernetes.io/name: mysql podTargetLabels: - app.kubernetes.io/instance podMetricsEndpoints: - port: "mysql-metrics" interval: "10s" scheme: https tlsConfig: insecureSkipVerify: true EOFTo check if Prometheus is successfully monitoring the instances, open the Prometheus UI in the browser and visit the
/targetsURI to check the status of thePodMonitorunderpodMonitor/prometheus/tanzu-mysql-instances/0 (1/1 up).You should view something similar to:
For details on the
PodMonitorAPI see PodMonitor in the Prometheus Operator documentation.
Using TLS for the Metrics Endpoint
During the Tanzu MySQL initialization, the Tanzu MySQL operator creates a metrics related self-signed certificate. The TLS credentials are stored in a Secret named after the MySQL instance name: if the instance name is mysql-db, the metrics Secret name is mysql-db-metrics-tls.
In order to use TLS for a metrics endpoint, configure Prometheus to use the CA certificate from the Secret. Use the following command to fetch the CA certificate:
kubectl get secret <MYSQL-INSTANCE-NAME>-metrics-tls -o 'go-template={{index .data "ca.crt" | base64decode}}'
where <MYSQL-INSTANCE-NAME> is the name of the MySQL instance.
For details on how to configure Prometheus with TLS, see tls_config in the Prometheus Configuration documentation.
MySQL Server Exporter Collector Flag Reference
Collectors are logical groups of metrics. Currently, the following collectors are enabled for Tanzu MySQL for Kubernetes.
- global_status
- global_variables
- slave_status
- innodb_cmp
- innodb_cmpmem
- query_response_time
- replication_group_members
- replication_group_member_stats
- replication_applier_status_by_worker
For more details on the collector list, see MySQL Server Exporter Collector Flags.

 Send Feedback