


In Best Practice 1, we suggested using the p99 latency to define an SLI. Development environments do not need to have service qualities as high as that of production environments and so can use the p90 latencies for an SLI measurement.
The p90 latency is the highest latency value (slowest response) of the fastest 90 percent of requests. In other words, 90 percent of requests have responses that are equal to or faster than the p90 latency value.
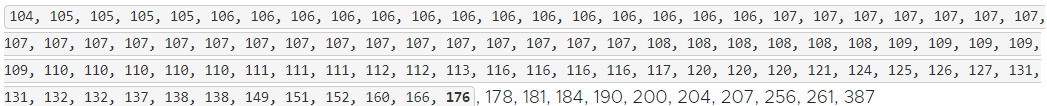
Then select the highest latency (slowest response time) from the highlighted data and emphasize it in bold. The p90 latency, which in this dataset is 176 ms, is in bold.
Because the p90 latency value in our dataset is 176 ms, you might think that a p90 latency would be a less stringent measure of user experience. As a reminder, the p99 for the same dataset was 261 ms. However, if you think about it in a slightly different way, it makes sense. This dataset can meet a p90 latency of 176 ms; however, it cannot meet a p99 latency of the same 176 ms value. The p99 latency is more difficult to achieve because it requires a greater percentage of requests to be below the selected SLI threshold.
The threshold set for an SLI in a development environment depends on what you expect developers to experience with 90 percent of the requests while working on an application. If the service quality is sufficient with 90 percent of requests having latencies lower than 176 milliseconds, a p90 latency of 176 ms is appropriate. However, if these latencies can be slower (perhaps to save in resource usage), set the p90 latency to a higher value.
