


To measure and monitor the health and performance of all the Service Level Objectives in your application, you can use the Global SLO (GSLO) Dashboard in Tanzu Service Mesh Console UI.
Use Global SLO Dashboard to Track the Status of All SLOs in Tanzu Service Mesh
Modern microservice-based applications bring a new set of challenges when it comes to operating at scale across multiple clouds. The primary goal of most modernization projects is to increase the speed at which business features are created, and this increased speed necessitates a highly flexible architecture based on microservices. As a result, the architectural convenience created on day 1 by developers becomes a challenge for site reliability engineers (SREs) on day 2.
It is expected that the business features will work at scale and demonstrate certain performance characteristics. However, developers may not know how much the final cost will be or whether they have the necessary compute resources. On the other hand, SREs will have the compute space needed, but may not know how to scale the microservices to meet the performance objectives.
Service Level Objectives provide tools for the site reliability engineers (SREs) to determine how well the applications are performing, based on clearly set SLO targets. As a result, consistency and stability in the platform are enhanced, enabling teams to make informed decision on platform releases.
Tanzu Service Mesh allows users to configure SLOs for services running in the global namespace. Users can use the existing console to troubleshoot and understand the SLO status of their services. With Global SLO Dashboard, users can track, monitor and manage their SLOs in a single view. Using the dashboard, users can search and filter GNS or Org Scoped SLOs, making it easier for them to manage their SLOs in one place. Users will know which SLOs are meeting the desired SLO targets and which ones are over a duration of 5 minutes to 30 days. Providing a clear understanding of the services that require attention which will allow for more effective capacity planning, better troubleshooting, and improved application productivity.
Prerequisites
Onboard your Kubernetes clusters where your services are deployed. For more information about onboarding a cluster, see Onboard a Cluster to Tanzu Service Mesh.
Configure one or more SLO policies. For more information about configuring SLO policies, see Configure an SLO Through the User Interface and Configure SLOs Through the API Explorer.
SLO Dashboard Overview
To access the SLO dashboard, in the navigation pane on the left, select .
On the Performance page, click the SLO Dashboards tab.
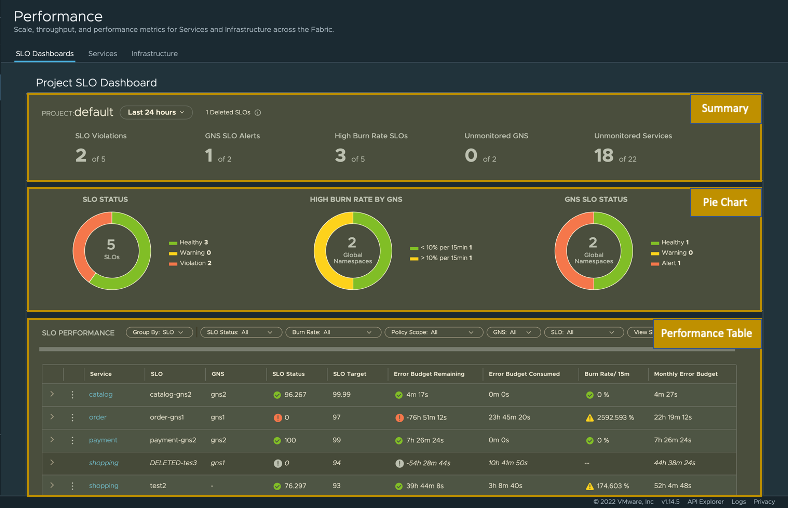
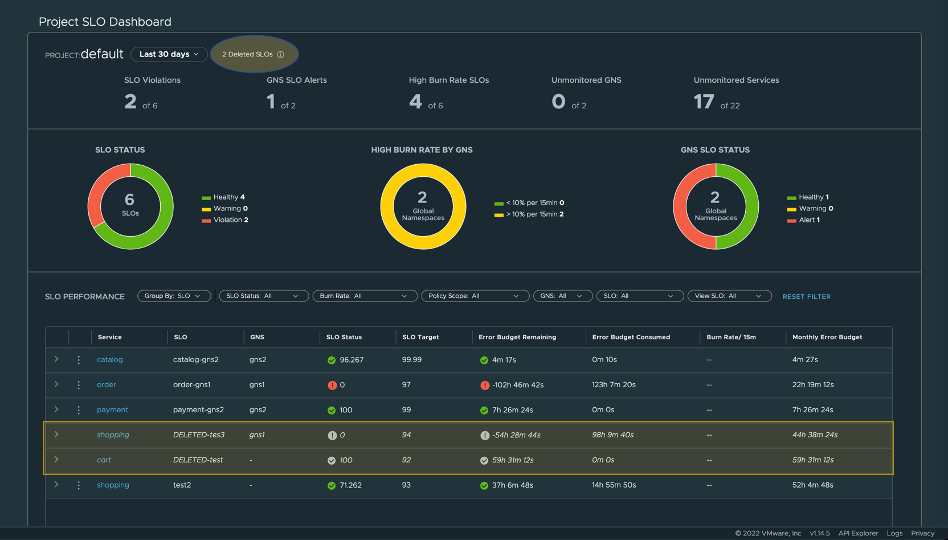
SLO Dashboard displays the project information that the user belongs to at the top and a time filter dropdown beside it. The dashboard displays all data in the selected time range. It has three sections (detailed in the following sections) that provide various information about SLO policies:
Summary. The Summary section displays aggregate counts.
Pie Charts. The Pie Charts section provides data on each category of SLOs and global namespaces.
SLO Performance table. The SLO Performance table lists all the SLOs and their services in the project.
A. SLO Summary
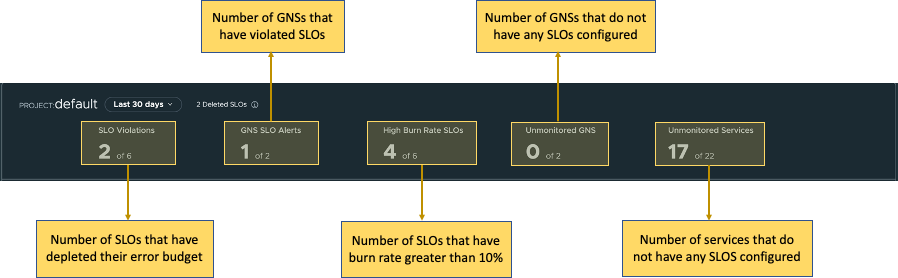
The SLO summary section displays the following information:
SLO Violations. Current number of SLOs that are in violated state, which means, that these services have passed their configured SLO and consumed their total error budget.
GNS SLO Alerts. Number of global namespaces that have SLOs in the violated state.
High Burn Rate SLOs. Number of SLOs that have burn rate greater than 10%. (See Burn Rate Calculation for more information.)
Unmonitored GNS. Number of global namespaces that do not have any SLOs configured.
Unmonitored Services. Number of services that do not have any SLOs configured.
B. Pie Charts
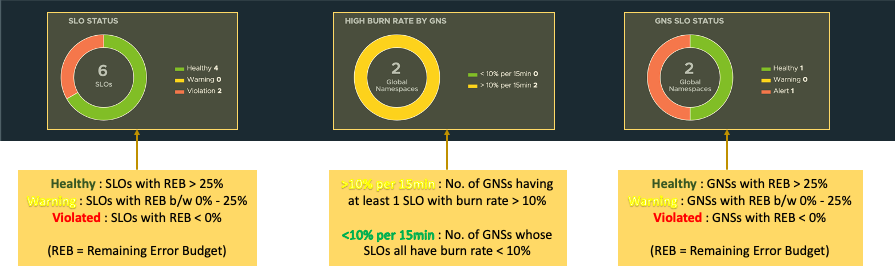
The Pie Charts section displays the following components:
SLO Status. SLO status displays the number of SLOs and their statuses, which are healthy, warning, and violated.
High Burn Rate By GNS. This metric displays the number of GNSs whose SLOs have a burn rate greater than 10%. (See Burn Rate Calculation for more information.)
GNS SLO Status. This displays the number of GNSs that have SLOs and their statuses, which are healthy, warning, and violated.
C. SLO Performance Table
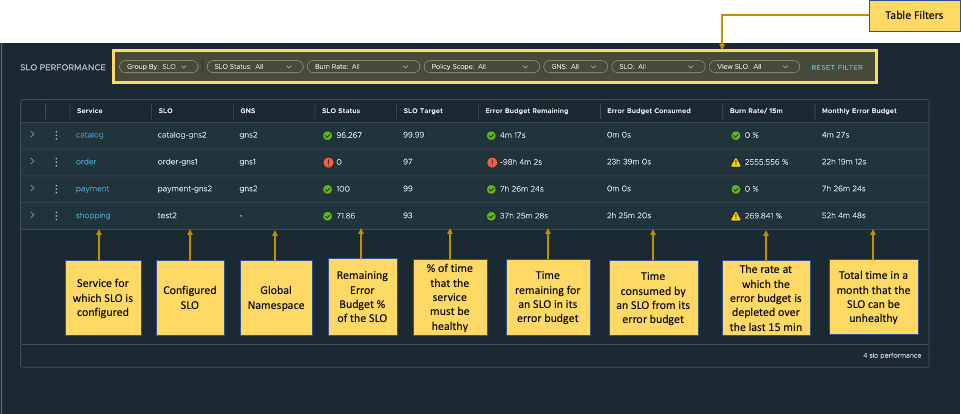
Column definitions in the performance table:
Service. Name of the service for which SLO is configured.
SLO. Name of the configured SLO.
SLO Status. Percentage of the consumed error budget.
SLO Target. Percentage of time the service must be healthy.
Error Budget Remaining. Time remaining in minutes for an SLO from the total error budget.
Burn Rate / 15m. Burn rate in percentage for an SLO in last 15 minutes.
Monthly Error Budget. Error budget assigned to an SLO in a month.
Error Budget Consumed. Error budget consumed by an SLO for the given time range.
Deleted SLOs
The total deleted SLO count is depicted in the summary section next to the time filter.
The table grid displays both the active SLOs and the deleted SLOs.
The deleted SLOs are indicated in the SLO column of the grid with a "DELETED" prefix.
There is no option to edit or delete these SLOs. Additionally, not all of the graphical representations are shown.
Burn Rate Calculation
For information on how burn rates are calculated for SLOs, refer to the Burn Rate Calculation section in the Tanzu Service Mesh SLO Configuration Reference.
