To measure and monitor the health and performance of the microservices in your application, you can create SLO policies through the Tanzu Service Mesh Console UI.
There are two ways to configure an SLO policy: monitored SLO and actionable SLO. You can configure multiple monitored SLOs; however, you can configure only one actionable SLO policy per service.
Procedure
- In the navigation pane on the left, select .
- On the SLO Policies page, click Add New.
- In the next window, select Monitored SLO or Actionable SLO and click OK.
- If you have selected Monitored SLO, follow these instructions:
- In the window that appears, provide an SLO name that is not already in use.
Ensure that there are no special characters in the SLO name. Optionally, add a description.
- Select the SLIs that the SLO is based on.
You can select one or more p50 Latency, p90 Latency, p99 Latency, and Error Rate SLIs.
- For each of the SLIs selected, type their respective thresholds.
If these thresholds are met or exceeded, they will deplete the error budget or, if it already depleted, the exceptions will count as violations of the SLO.
- In the Service Level Objective section, specify the percent of time that the SLIs will be under their threshold values. Click Next.
Important:
Set the time percentage to slightly less than 100%. The performance tab will display Unknown status if the time threshold is set to 100% since no service can reach 100% uptime.
- In the next window, select the services that the new SLO applies to. Under Service(s), select one service from the drop-down menu. To add more services, click +Add Services and select another service from the drop-down menu.
You can also apply the SLO to service groups on top of the individual services selected in the previous step. You can apply SLOs to any combination of services and service groups.
- Click Next.
- Review the SLO configuration and click Save.
- If you have selected Actionable SLO, follow these steps.
- In the window that appears, provide an SLO name that is not already in use.
Ensure that there are no special characters in the SLO name. Optionally, add a description.
- Specify the name of the GNS Scope.
- Select a Target Service.
- (Optional) Specify a label for the SLO policy.
- Select the SLIs that the SLO is based on.
You can select one or more p50 Latency, p90 Latency, p99 Latency, and Error Rate SLIs.
- For each of the SLIs selected, type their respective thresholds.
If these thresholds are met or exceeded, they will deplete the error budget or, if it already depleted, the exceptions would count as violations to the SLO.
- In the Service Level Objective section, specify the percent of time that the SLIs will be under their threshold values. Click Next.
- (Optional) In the next window, to enable service autoscaling, select Service Autoscaling.
Enabling this action allows the services to be autoscaled based on SLI conditions and violations. However, note that you must configure an autoscaling policy for each of the service versions.
- Review the SLO configuration and click Save.
- To edit an existing SLO configuration, perform these steps.
- Click the vertical three dots to the right of an SLO.
- On the menu, click Edit Configuration.
- To advance through and edit the configuration pages, click Next.
- To update the configuration, on the final page, click Save.
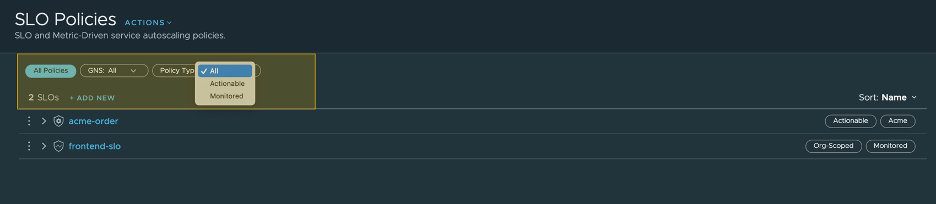
- To find a specific SLO policy, use the highlighted filters in the SLOs page.