


You can use the SLO Policies dashboard to view and track SLOs defined for your services.
The SLO Policies dashboard provides graphical representations of the SLIs, SLOs, and error budgets. The dashboard displays how the services have performed over the last month and helps you track the status of the SLOs and the health of your services by displaying this information in real time.
Prerequisites
Procedure
- To access the SLO Policy dashboard, perform these steps.
- In the navigation panel on the left, select .
- Click the SLO policy name.
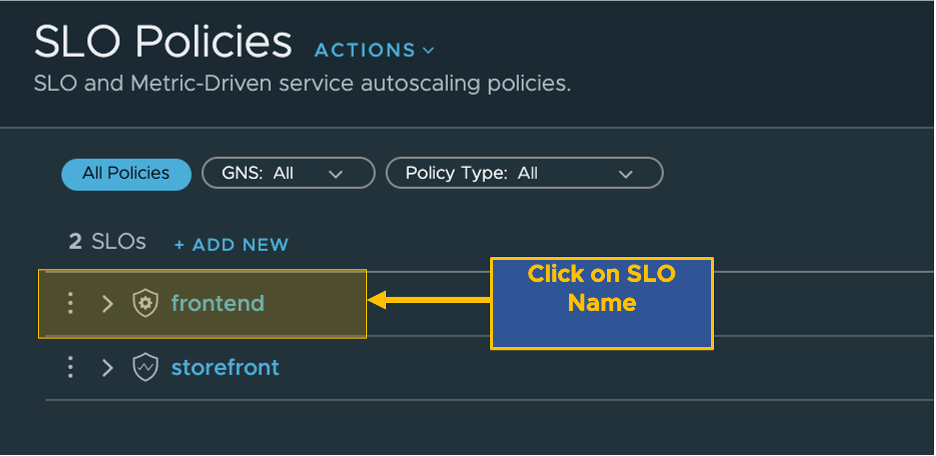
The following screenshot has been labeled, and certain areas of the sample dashboard are highlighted to explain the features of the SLO Dashboard viewer.
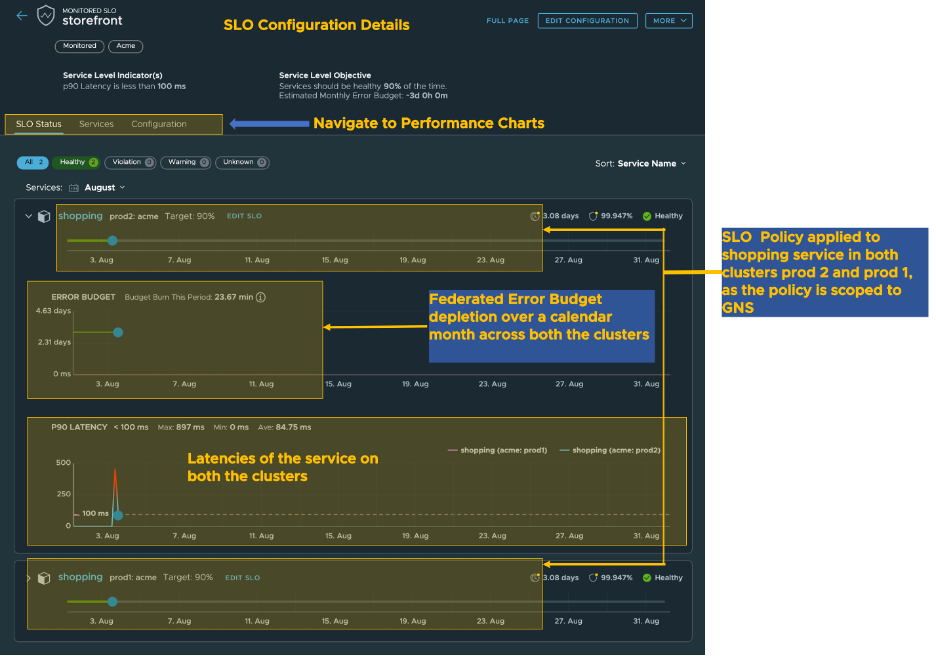
The dashboard consists of the SLO Status, Services, Service Groups, and Configuration tabs and provides the following information for the SLO policy:A. The configuration details of the SLO policy:
The defined SLIs (for example, target latency values and a target error rate)
The service level objective set in the SLO
B. SLO Status shows the overall health of the microservice against the SLO over a calendar month.
The label Healthy shows the number of services that are within the SLI threshold set in the SLO policy.
The label Warning shows the number of services that nearing violation the SLO policy.
The label Violation shows the number of services that have violated the set SLI threshold.
Also displayed is the total number of services, along with which number of services that are in Healthy, Violation, and Warning status.
C. You can sort the data on the dashboard by these criteria:
Service Name
Current Health State
Health this Period
Remaining Error Budget
D. SLOs are monitored over a period of a calendar month.
E. Shows how the SLO is performing, yellow indicates a warning for a depleting Error Budget due to an SLI violation, Red indicates that the Error Budget is completely depleted and Green Indicates that the Error Budget is stable and the SLI ‘s is within the target threshold.
F. Error Budget Chart displays Consumed Error Budget (Change) over a month. Error Budget is at the GNS level and is depleted when any of services within the global namespace, violates the set target SLI threshold.
G. Latency Chart. Shows a multiplot graph, displaying how the services are performing against the defined SLIs.
H. To view more details and gain a better understanding of the behavior of the service, expand the service section.
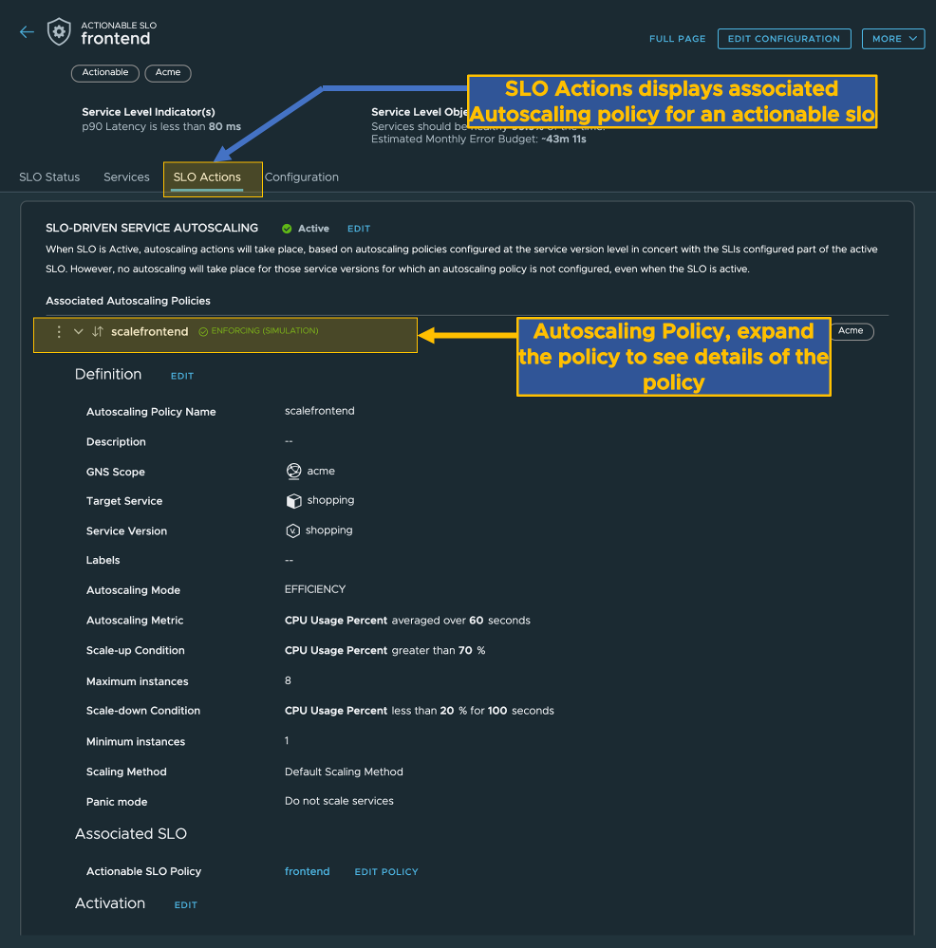
- If you have created an actionable SLO, to view the autoscaling policies associated with the actionable SLO, click the SLO Actions tab.
Results
The SLO Dashboard presents multiple benefits to observe the health of services, including these benefits:
You can use this graph to monitor and observe the health of services and view the performance of the services over a month.
You can use the multiline plot SLI charts to identify which services in the global namespace have violated SLI thresholds.
You can also use the graph to determine which service requires more attention. For example, you can sort the services by current health status.
Using the graph, you can drill down into the behavior and performance of each service. For example, you can track what caused the depletion of the error budgets in a given month or monitor when the latencies were at their highest.
