


Tanzu Service Mesh provides detailed information to help you monitor the performance of an external service. This information includes the performance metrics. You can also view the different details about the external service, including its configuration.
You can monitor the performance of an external service and view the details and configuration from its details page in the Tanzu Service Mesh Console UI.
Prerequisites
Procedure
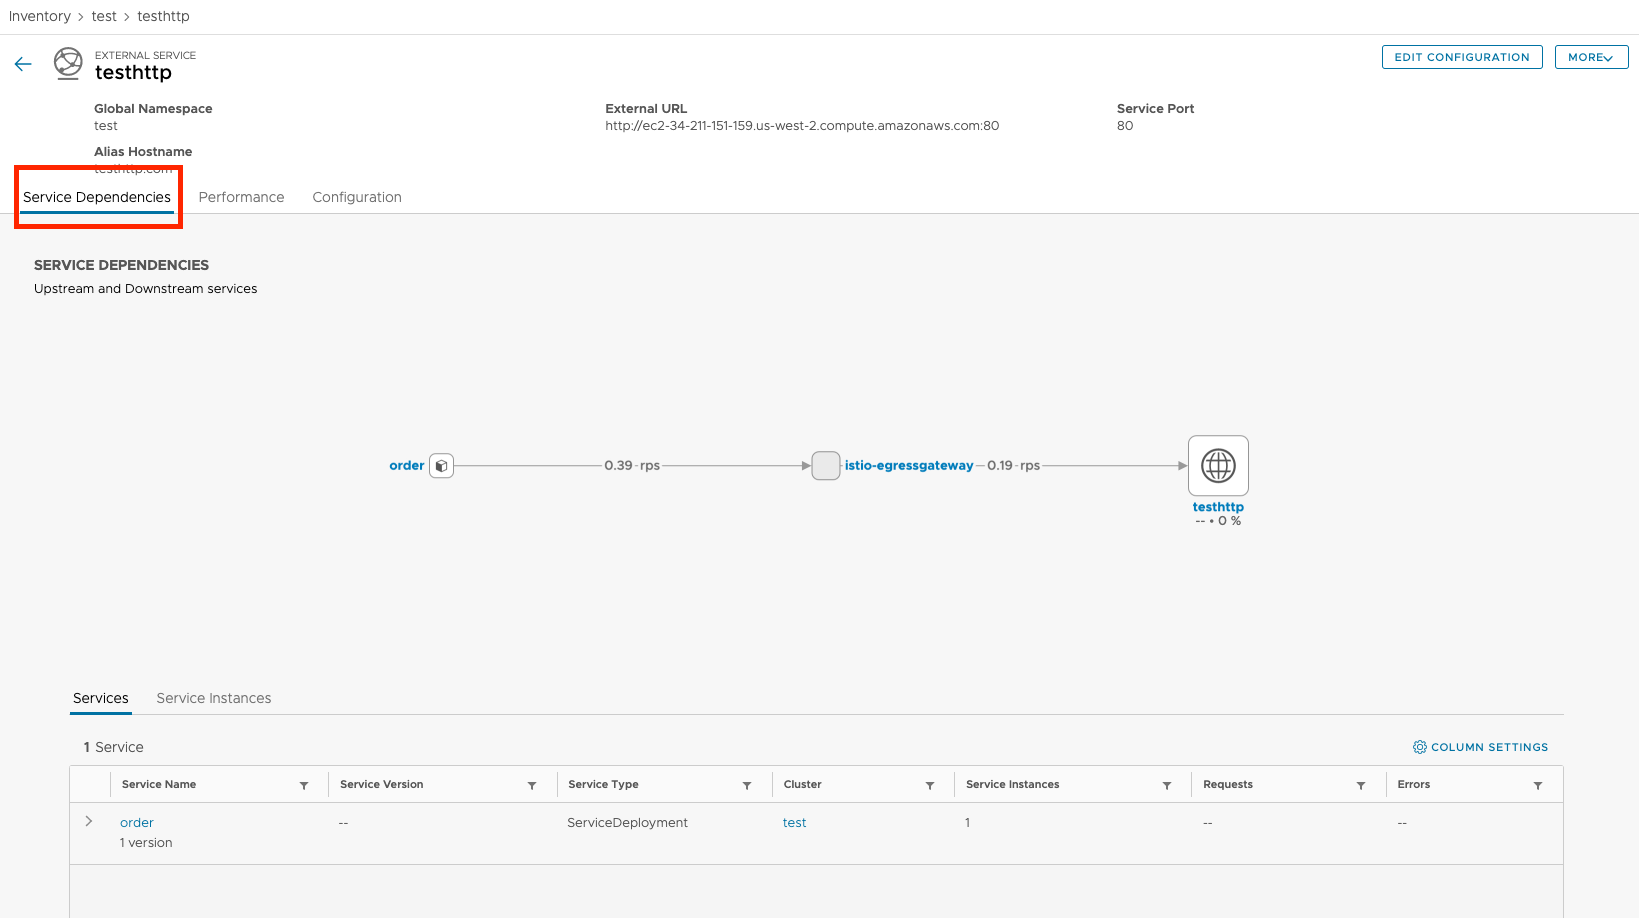
- When we select a specific external service, we will see the Service Dependencies page, which will list the services inside global namespace that are contacting it.
- To monitor the performance of the external service on the different clusters by using metric charts, click the Performance tab.
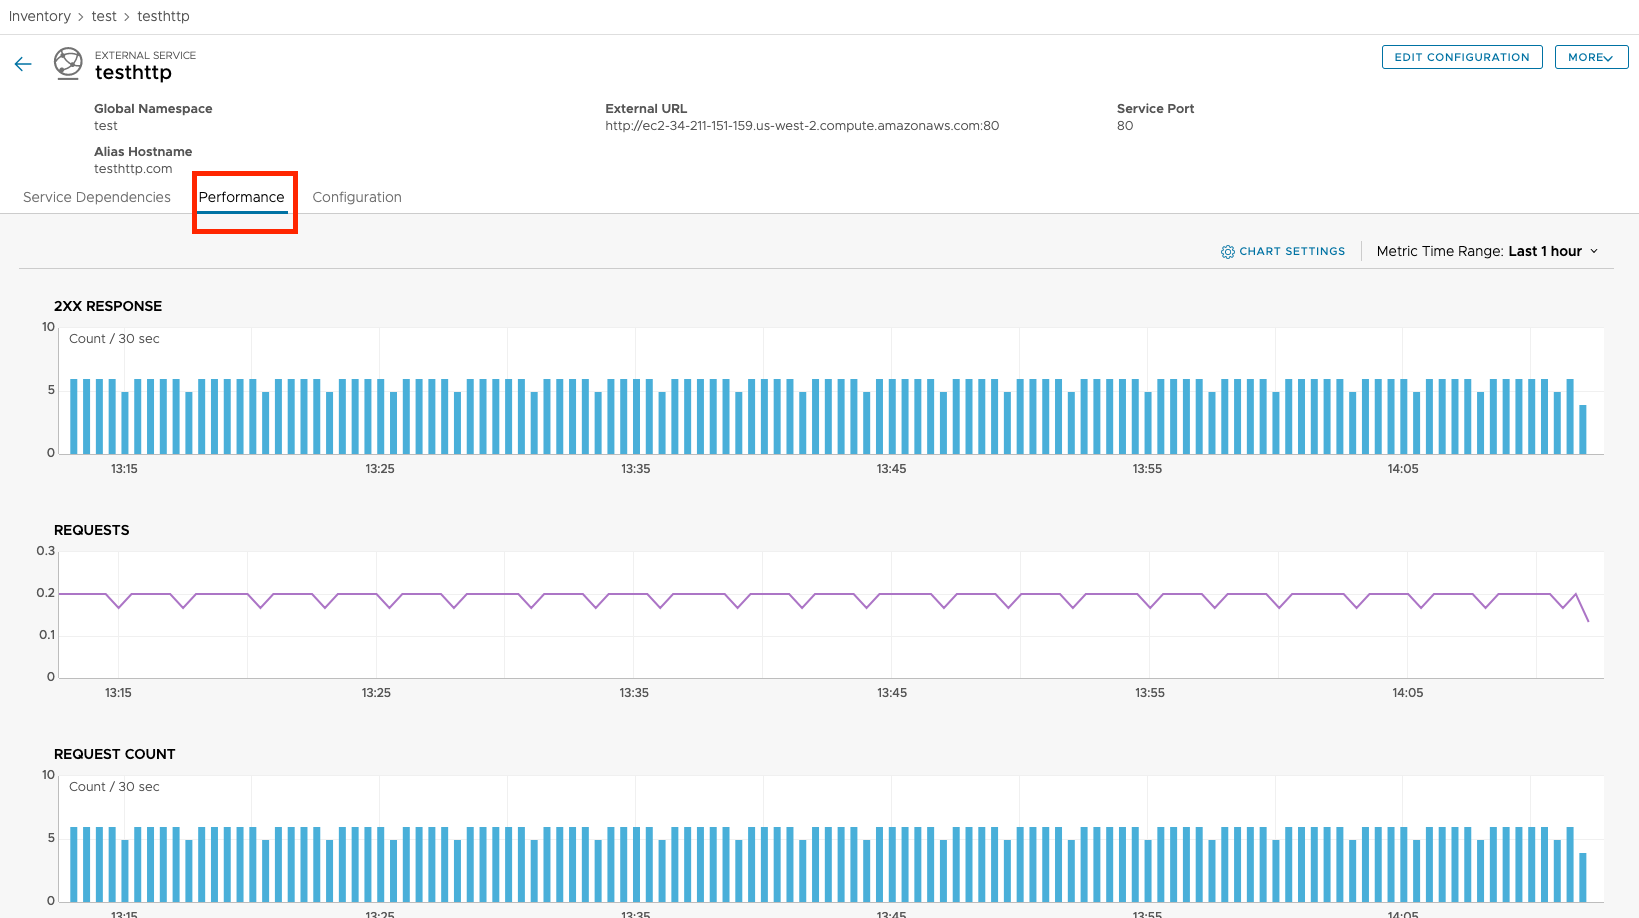
The performance charts on the Performance tab displays metrics collected for the external service in the time range selected in the Metric Time Range drop-down menu in the upper-right corner.
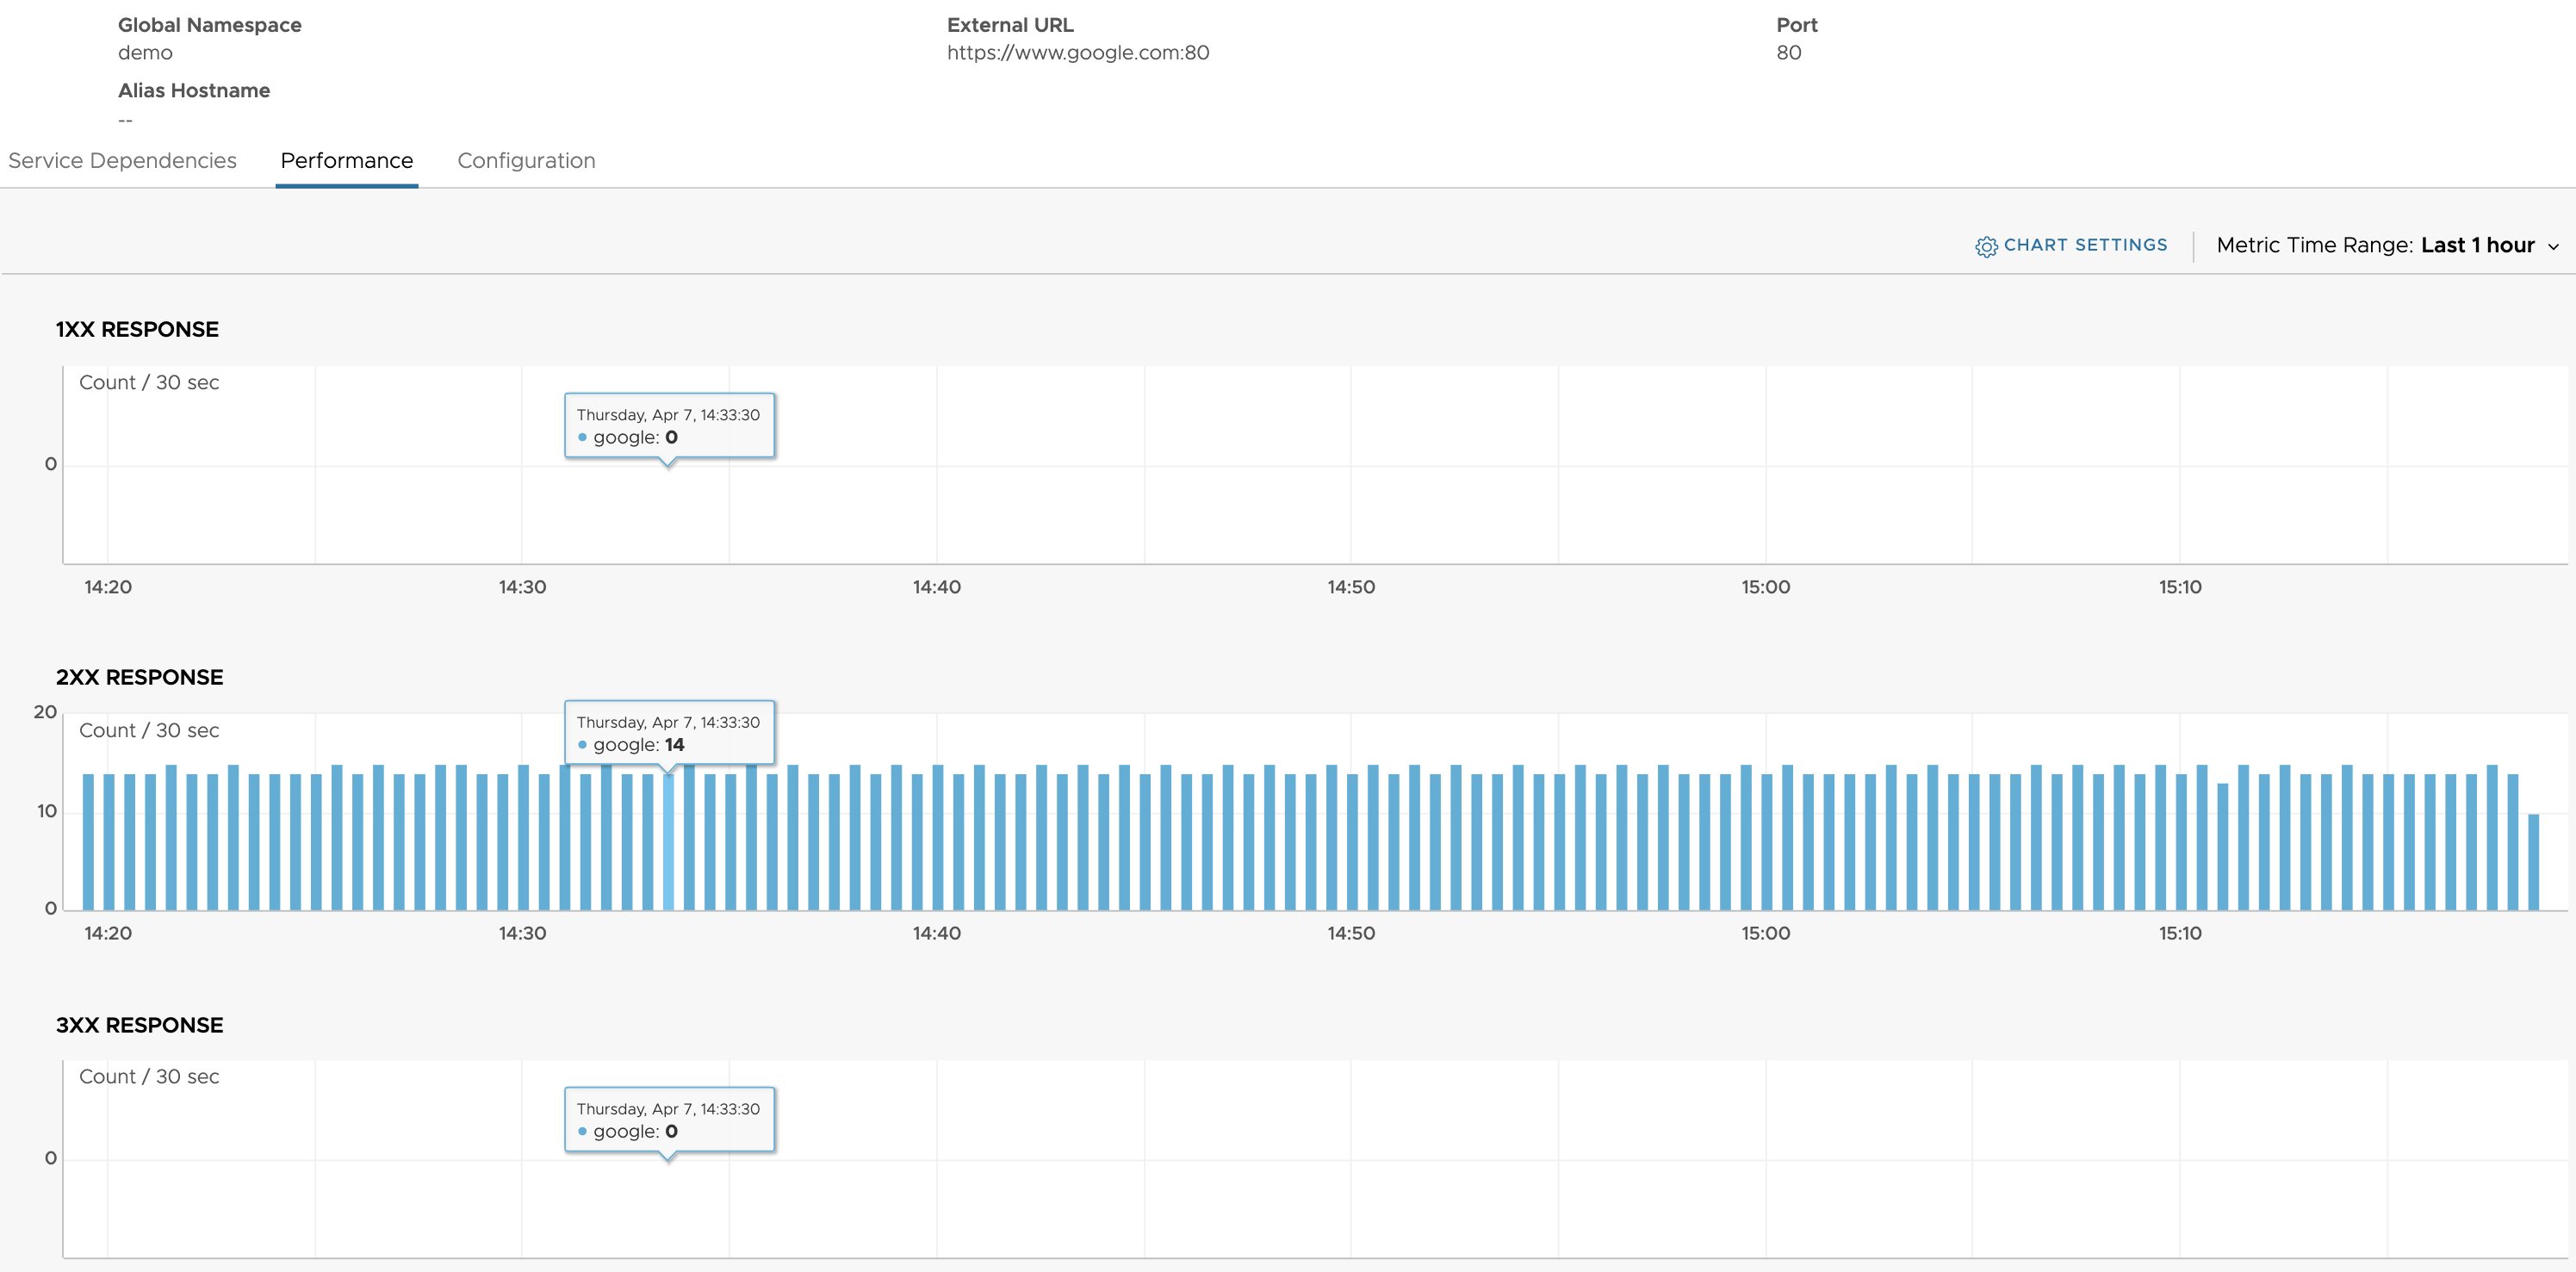
Note:HTTP response status codes indicate whether a specific HTTP request has been successful. These responses are divided into five categories:
Informational responses (1XX)
Successful responses (2XX)
Redirection messages (3XX)
Client error responses (4XX)
Server error responses (5XX)
- To view the metric values collected at a specific date and time, point to the appropriate data point on the chart, as shown the example below.
- To display only the metrics that you want on the Performance tab, in the upper-right corner, click Chart Settings and select the check box next to each metric that you want to display.
You can select a maximum of four metrics to be displayed.
- To view the configuration of the external service, click the Configuration tab. The Configuration tab displays the configuration details for each external service.

