


You can create a service group to manage a group of services collectively. You can observe aggregated metrics for the services in the group or consistently enforce policies across the service group.
A service group is a type of resource groups. A service group is a collection of services that share certain characteristics. A service group defines one or more conditions that a service must satisfy to be included in that group. For example, a service group can define a condition for the service name to begin with shopping.
Service groups serve two main purposes:
You can create a service group to monitor relevant metrics (such as requests per seconds, latency, and error rate) for the services in the group collectively.
You can also define and apply consistent policies to the entire service group.
You can use a sample service group to create a service group in Tanzu Service Mesh. The service group is used to collectively manage all cart services deployed in clusters located in California. The sample service group defines conditions for the service name to begin with cart , for the cluster name to be prod-cluster-ca, and for the services to be in the default or sample namespace in the cluster.
You can access and observe metrics for the services in a service group.
Prerequisites
Verify that you have onboarded the clusters where your services are deployed. For more information about onboarding a cluster, see Onboard a Cluster to Tanzu Service Mesh.
Procedure
- Define conditions for membership in the group.
- Under Membership Conditions, click Add Condition and select a service attribute or metric for which you want to define a condition (for example, Service Name or Namespace).
- In the new condition row, select an operator (for example, Is Exactly or Starts with) in the second drop-down menu and select or enter a value in the third drop-down menu.
- To define additional conditions, repeat steps a–b.
If you have multiple conditions, by default the conditions are joined with the
ANDoperator. A service is matched if all the conditions are true. - To join the conditions with the
ORoperator to specify that any of the conditions can be true for a match, click the AND button on the left.The label on the button changes to OR to indicate that the conditions are joined with the
ORoperator. - To combine two or more conditions in a complex condition, point to one of the condition rows that you want to combine and click
 at the right end of the row and click Add Condition to add another condition to combine.
For the example, the following conditions for membership are defined in the service group. The conditions include a complex condition for the default and sample-namespace namespaces where the conditions are joined with
at the right end of the row and click Add Condition to add another condition to combine.
For the example, the following conditions for membership are defined in the service group. The conditions include a complex condition for the default and sample-namespace namespaces where the conditions are joined withOR.
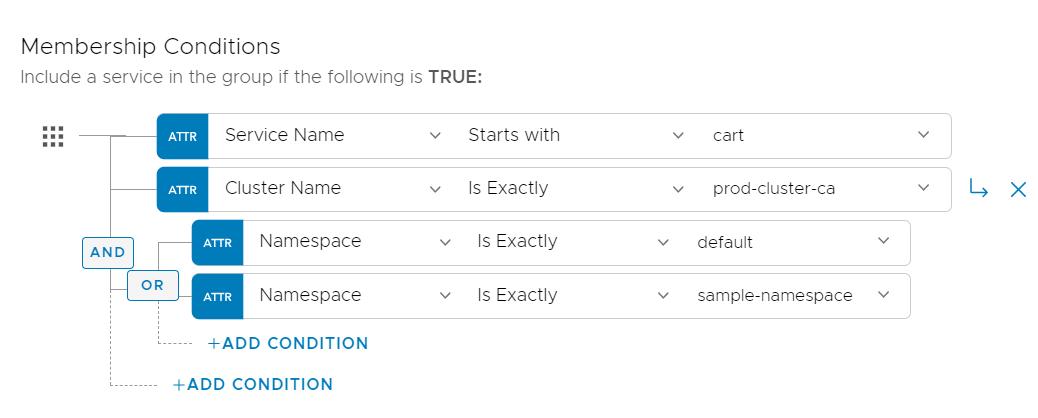
According to these conditions, a service is included in the service group if it meets these requirements:If the name of a service starts with cart.
The service is located in the prod-cluster-ca cluster.
The service is contained in the default namespace or the sample-namespace namespace.
