VMware Telco Cloud Operations supports multiple metric types. The data collected uses out-of-the-box collectors including Smarts and MnR Gateway. All data collected is mapped to one of the VMware Telco Cloud Operations metric type models.
Each metric type includes metadata that defines and describes the characteristics of each metric collected. The following is the JSON definition table for the standard parameters within each metric:
| JSON | Description |
collectorType |
The collector or KPI type. |
collectorInstance |
The collector or KPI instance. |
collectedTimestamp |
The time (in milliseconds) when the metrics were collected by the collector or KPI. For example, 00:00:00 Jan 1, 1970 UTC. |
processedTimestamp |
Internal usage. |
metricType |
The type of metric. For example, Availability. |
properties: |
|
dataSource |
The IP address or host name of the data source. |
deviceType |
The type of the device. For example, a switch, firewall, or server). |
deviceName |
Instance name of the device. |
entityType |
The type of the entity in the device (for example, port, or interface) to which the below metrics belong. |
Tags: |
|
model |
The model of the device. |
version |
The version of the device. |
customer |
A customer or tenant identifier. |
location |
The location of the device. |
city |
The city in which the device is physically located. |
address |
The street address where the device is physically located. |
zip |
The postal code of the address where the device is located. |
region |
The region where the device is located. |
deviceCoordinates |
The geographical coordinates of the location where the device is located. |
The following is an example of how the standard parameters appear within each metric:
{
  "collectorType" : "Kafka-Collector",
  "collectorInstance" : "KC-1",
  "collectedTimestamp" : 1573186658,
  "processedTimestamp" : 1573186658,
  "metricType" : "Availability",
  "properties" : {
    "dataSource" : "10.100.10.10",
    "deviceType" : "Router",
    "deviceName" : "Router-1.1.1.1",
    "entityType" : "Interface",
    "entityName" : "Interface-113/m1"
 },
  "metrics" : {
    "Availability":     "100",
    "Reachability":     "100"
 },
  "tags" : {
    "model" : "CAT-100",
   "version" : "1.0.0.1",
    "customer" : "customer-1",
    "location" : "main street",
    "city" : "Zurich",
    "address" : "abc",
    "zip" : "90882",
    "region" : "region-1",
    "deviceCoordinates" : "45.444348, -75.693934"
 }
}
Using a Tool Data Set from a Customer
Customers can use third-party vendors to collect metrics, for example, Metricbeat or OpenStack API.
Metricbeat Example:
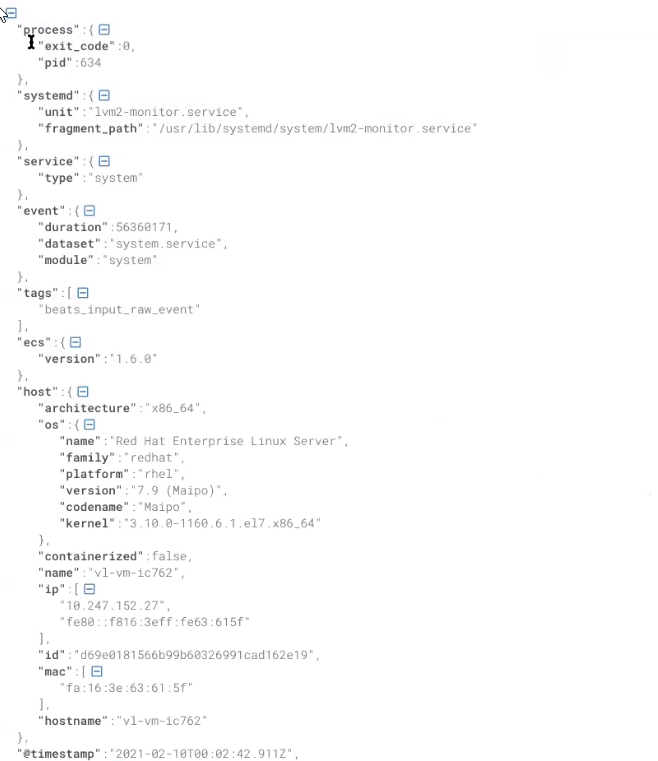
Metricbeat can be deployed on any VM or any Bare Metal server. Metricbeat collects data associated with a customer system, for example, resources, processes, and process states. Metricbeat has formatting of its own that can be published on the Kafka bus. To get the information into VMware Telco Cloud Operations, the Metricbeat data must be mapped. If there are no data that map to VMware Telco Cloud Operations metric models, than a generic metric model is used. The VMware pipline takes the generic model and publishes the data into Elasticsearch. Then customer must create reports reports from the generic metric data types.
The following is an example of Metricbeat formatting:

OpenStack API Example:
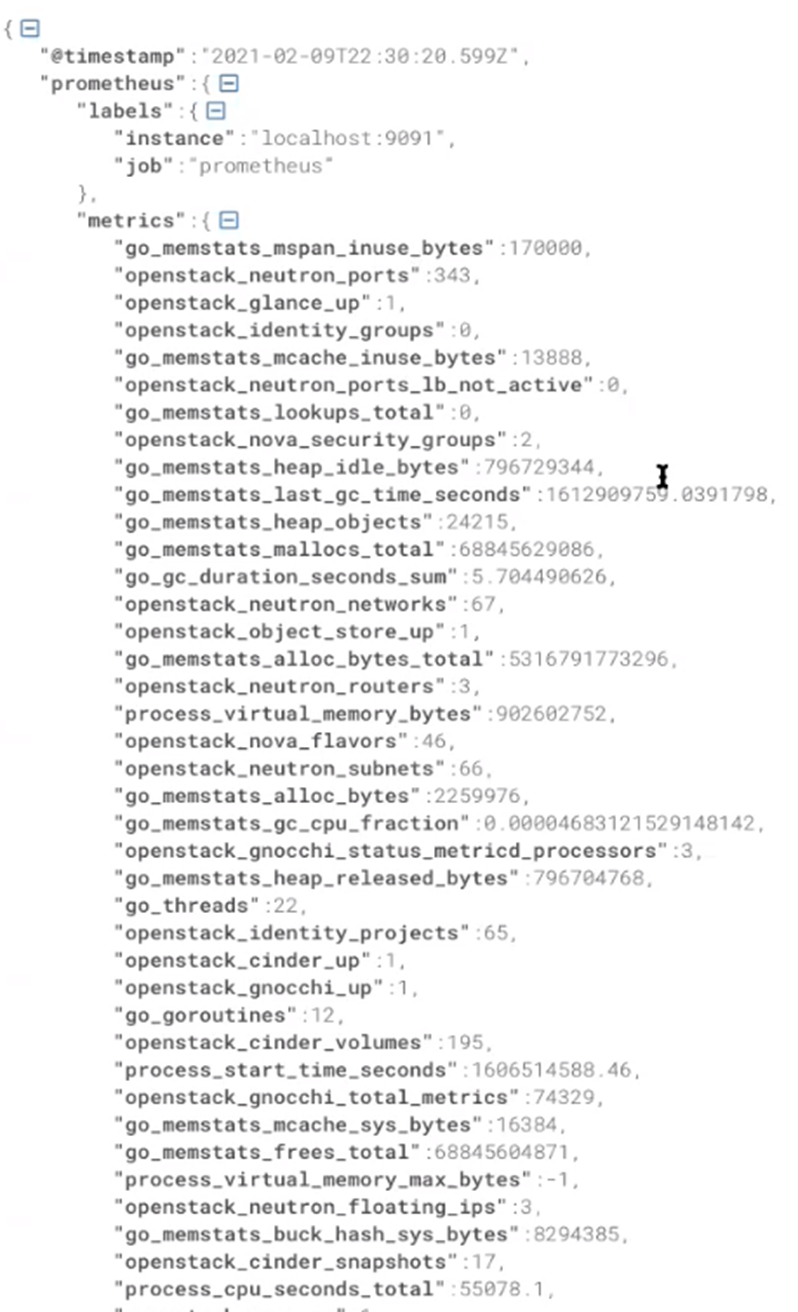
The following data formatting is created leveraging the OpenStack API. In this example, a customer created their own collectors and collected details around OpenStack services and plugins. When this minimal data set is received, VMware Telco Cloud Operations, can help the customer enhance their collectors to include additional metadata mapped to a VMware Telco Cloud Operatations model.