The Polling and Thresholds Console is used to display groups and modify their properties. To open the Polling and Thresholds Console:
-
Start the Global Console.
-
On a UNIX system, go to the BASEDIR/smarts/bin directory in the Service Assurance Manager (Global Manager) installation area and enter sm_gui.
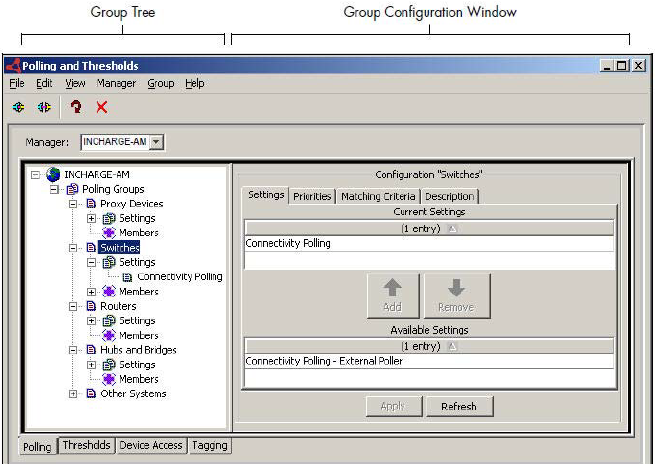
The Attach Manager dialog box opens, an example of which is shown in Attach Manager dialog box.
Figure 1. Attach Manager dialog box 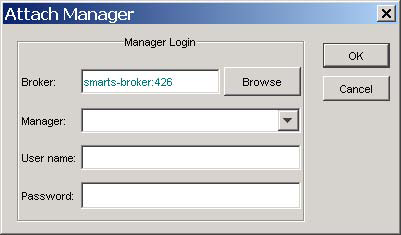
-
-
In the dialog box,
-
Ensure that the Broker for your deployment appears in the Broker text box.
-
Click the Manager drop-down list or the Browse button to display a list of active (running) Managers, and from that list select an IP Manager application (for example, INCHARGE-AM) in your deployment as the Manager to which you want to connect.
-
Enter your login username and password. (The default administration login is username admin and password changeme.)
-
Click OK.
The Topology Browser Console opens.
-
-
-
In the Topology Browser Console, choose Configure > Domain Manager Administration Console. The Domain Manager Administration Console opens.
-
In the Domain Manager Administration Console, choose Configure > Polling and Thresholds.
The Polling and Thresholds Console opens, an example of which is shown in Polling tab for IP Availability Manager.
Figure 2. Polling tab for IP Availability Manager