


VMware Telco Cloud Service Assurance is a holistic service assurance solution that allows Communications Service Providers (CSPs) and large enterprises to monitor and manage both the traditional physical infrastructure and new virtual and containerized network services together. The micro-services architecture enables flexibility and scale in VMware Telco Cloud Service Assurance.
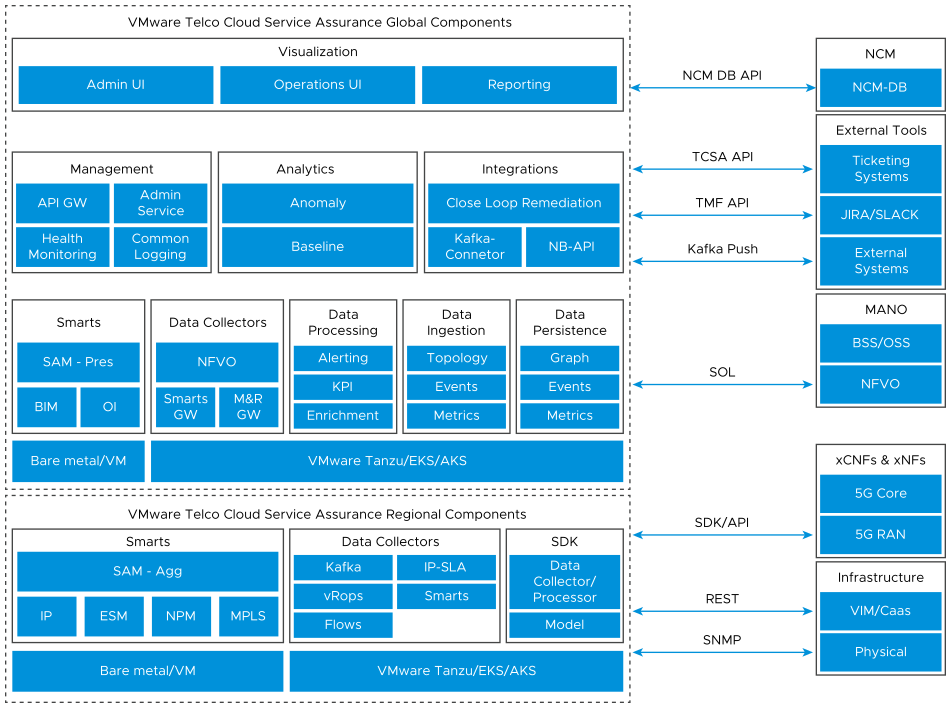
VMware Telco Cloud Service Assurance enables Telco operators to manage and operate their 5G network and services from a single pane of glass. It provides:
- Cross-domain visibility of the entire 5G RAN service stack, from the underlay infrastructure to the service, and supporting integration with NFV and RAN orchestrators for RAN auto discovery.
- Comprehensive health and performance monitoring from the RAN to the Core network, including network slice mapping.
- Just-in-time Root Cause Analysis that can identify the cause of service loss or degradation across multiple domains and a multi-vendor stack.
- Mission-critical impact analysis to enable you to prioritize remediation and resolution based on, for example, the number of impacted customers or SLA requirements.
- Closed-loop automation and remediation with prescriptive RCA and monitoring insights provided to management and orchestration tools.
VMware Telco Cloud Service Assurance consists of multiple components and their functions are:
| Components | Description |
|---|---|
| Domain Manager Components | Following components are used in VMware Telco Cloud Service Assurance:
|
| Gateway | VMware Telco Cloud Service Assurance Gateway is a component that acts as an entry point to ingest metric data from an external system (M&R Gateway and Smarts Gateway) to VMware Telco Cloud Service Assurance. |
| Operation UI | The Operation UI is a versatile tool for monitoring and reporting performance data, topology data, and fault notifications for all aspects of your infrastructure. The Operation UI has modules that collect, aggregate, and insert data into one or more databases that the portal uses to display reports. |
| Reporting | The reporting allows you to create, modify, and delete the improvised performance metric dashboards and reports for the supported data models. |
| Alarming | The VMware Telco Cloud Service Assurance provides alarms to call your attention to events that can potentially affect performance and system operation. Alarms provide detailed event information such as which component is affected, the type of event, and then recommends a corrective action. |
| Analytics | The Baseline and Anomaly detection analytics solution in VMware Telco Cloud Service Assurance provides a performance monitoring and learning approach for the active operations management. |
| Mapper | The mapper is a utility where, an administrator can map an external model to the internal model. |
| Enrich | Enriches and tags data collected by the Data Collector Service with externally provided reference data. |
| Collectors | Manages the lifecycle of Kafka, SNMP, REST and other collectors, which ingest the data into VMware Telco Cloud Service Assurance through push and pull mechanisms.
|
| 5G Integration | With the 5G Integration feature, you can configure Virtualized Infrastructure Managers (VIM), Orchestrator, Physical layers, and Kafka Collector and Metrics Mapping to measure traffic flow across the network and collect events and metrics data.
5G Integration consists of the following layers:
|
