


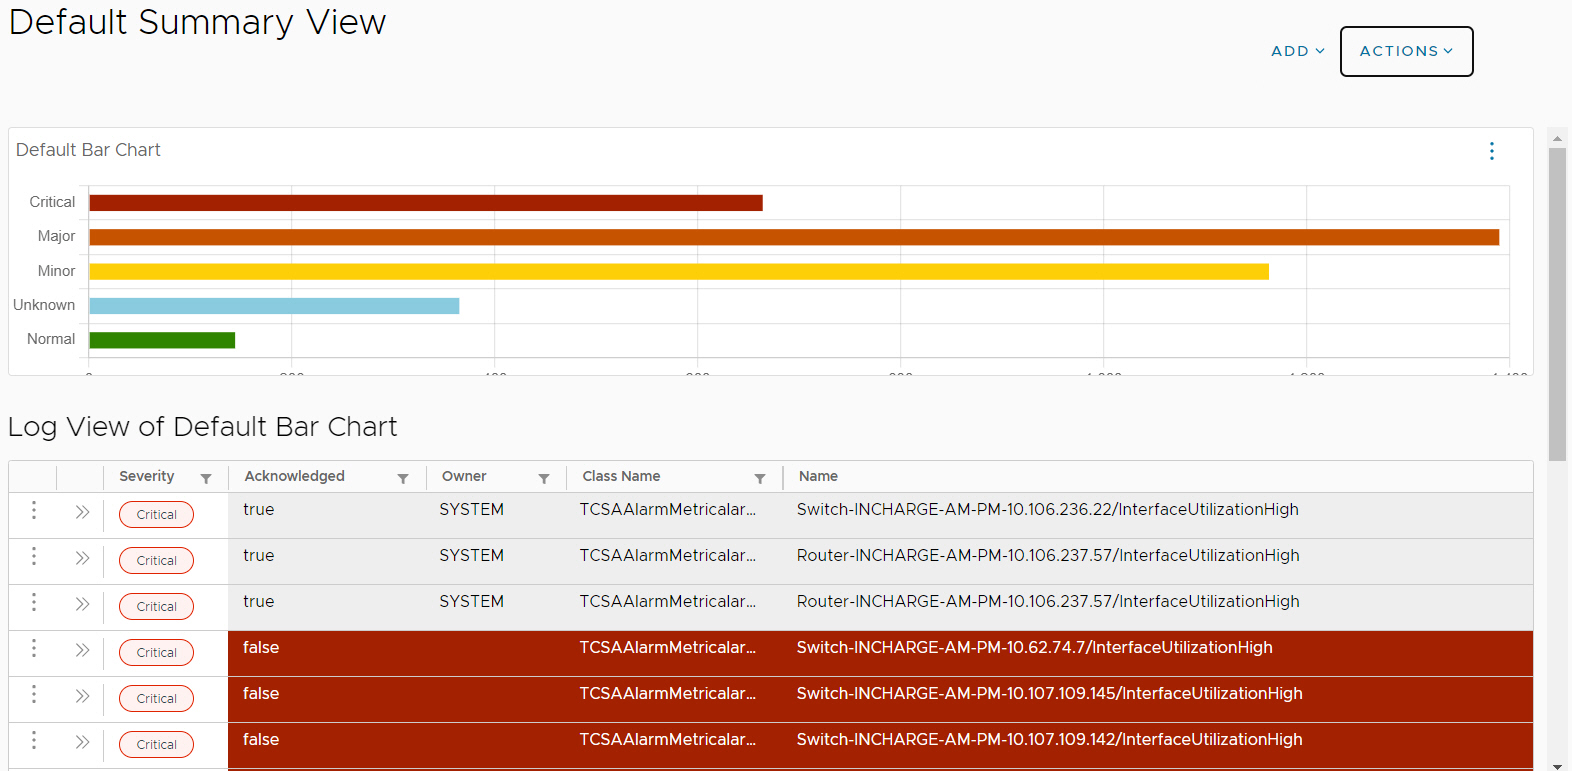
The Notifications Summary View provides a graphical display of the information as a form of Bar Chart. Also, Log View of Default Bar Chart is displayed in the Summary View console. By default, a summary is updated continuously.
Default Summary View Page
To view the default summary view page, navigate to , where the default created notification displays. For more information on sharing summary view, see the Sharing Summary View.
You can perform the following operations:
- Add:
- Summary view: Allows you to add a new summary view.
- Chart: Allows you to create the bar charts.
- Actions:
- Edit summary view: Allows you to edit existing summary view.
- Clone summary view: Allows you to clone the complete summary view, and also to update preferences of the cloned summary view including name.
- Share summary view: Allows administrator to share the summary view with other roles (for example, administrator can share any summary view with operator or enterprise role user).
Also, you can create multiple summary views. The multiple summary views are filtered based on location, region, technology, and class name.
The
Default Bar Chart represents the number of notifications categorized by the severity level. You can refresh, edit and clone a bar chart.
- Refresh a chart: Allows you to refresh the existing bar chart. To refresh chart, click ellipsis icon (three vertical dots) and select Refresh.
- Clone a chart: Allows you to clone the existing chart. To clone chart, click ellipsis icon (three vertical dots) and select Clone.
- Edit a chart: Allows you to edit the existing chart. To edit chart, click ellipsis icon (three vertical dots) and select Edit.
The
Log View of Default Bar Chart provide following information:
- Notification Name (Event Name): Each notification has a unique name. A notification’s name consists of the class name and instance name where the event occurred, and the event name.
- State (Active or Inactive): Indicates the state of the event. Values can be ACTIVE (notified), SUSPENDED, WAS_ACTIVE, or INACTIVE (cleared).
- Acknowledgment status (True or False): Indicates the event has been acknowledged.
- Severity: A graphical severity (color-coded) that categorizes the severity level of the event from the notifier's point of view. For more information, refer Notification Severity.
- Source: Identifies the software component(s) that diagnosed the event, where the event originated (for example, a Global Manager and Domain Manager).
- Owner: The username of the person responsible for handling the event.
- Impacted Class Name: The class name of the topology element associated with the event in the repository where this event resides. This may or may not have the same value as Class or may be empty.
- Impacted Element Name (or IP address): The name of the topology element associated with the event in the repository where this event resides. The string is empty if there is no related element. This may or may not have the same value as InstanceName.
- Impacted Instance Name (or IP address): Name of the instance where the problem was diagnosed. One of three attributes that uniquely identifies a notification, not modifiable.
- Business Impact: If Business Impact Manager is available, the sum of the weights for all affected elements. The default weight for each affected element is 1. Weights quantify the event impact on the infrastructure and business processes. A large numeric value indicates a large impact.
- Occurrence Counts: The number of occurrences of this event starting from First Notify until Last Notify.
