


Note: Spring Insight templates are no longer supported. The documentation is here for reference only.
Spring Insight Developer enables you to see what your application is doing under the hood of @annotated APIs or proxied objects. Popular frameworks of today hide tremendous power behind friendly facades. For example, a simple session.save(book) that uses Hibernate can execute hundreds of JDBC calls, depending on your mapping. Spring Insight brings these low-level performance-oriented operations to the screen for quick evaluation.
Before You Begin
Before you start using Spring Insight:
- Install tc Server Developer Edition and create a tc Runtime instance using the Spring Insight template. See Installing and Configuring Spring Insight.
- Start the tc Runtime instance, deploy your Web application to the instance, configure all of its resources (such as any required JDBC data sources), and make sure your application is running and ready to be used.
To deploy a Web application to a tc Runtime instance, copy its WAR file or exploded directory to the deployment directory, which by default is CATALINA_BASE/webapps where CATALINA_BASE is the root directory of the tc Runtime instance.
For example, assume that you created an instance called insight-instance using the provided insight template and that you have already started the instance. Further assume that the CATALINA_BASE of this instance is /home/tcserver/pivotal-tc-server-developer/insight-instance and that the full pathname of your Web application is /home/apps/myApp.WAR. To deploy this application to the tc Runtime instance, execute the following command:
prompt$ cp /home/apps/myApp.WAR /home/tcserver/pivotal-tc-server-developer/insight-instance/webapps
For complete documentation about tc Server, see the Pivotal tc Server 3.x Documentation.
Invoke Spring Insight
Follow these steps to invoke Spring Insight in your browser and to start seeing trace data.
Browse to the Spring Insight dashboard at the following URL:
http://localhost:8080/insightNote: In Spring Insight Developer, you can access the Spring Insight dashboard only from the
localhost.The browser invokes the main Spring Insight dashboard on the Browse Resources screen:
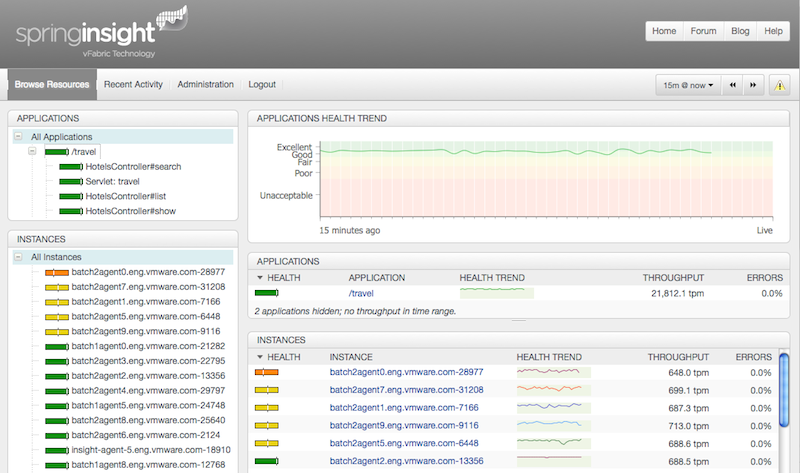
Initiate activity by using your Web application; the exact steps depend on what your application actually does.
Spring Insight traces all application activity and displays it on the dashboard. For example, if you performed any JDBC queries, each one is shown in the Spring Insight dashboard along with a timeline of recent requests.
Browse Applications and End Points
The following procedure describes how to browse the applications deployed to the tc Runtime instance and their End Points, and view health, throughput trends, response time trends, and response time histograms.
The Browse Resources screen shows information for all types of applications, but provides more detail for Spring, Grails, and Roo applications.
From the main Spring Insight dashboard, click the Browse Resources link:
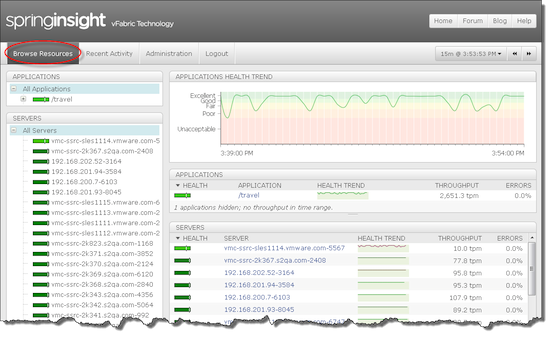
The Applications panel on the left displays a tree control of all applications that have reported Traces; you can expand each application to see its list of End Points. The health of the application is displayed next to its name and represents the worst-performing End Point within the Application. Each End Point also displays its health, which is described later on in this procedure.
Spring Insight loads the resource tree when it loads the page. If you subsequently deploy a new application or Spring Insight detects new End Points, it automatically adds these resources into the resource tree.
The Applications Health Trend panel on the right shows a graph of the recent health of all applications. The health of each application is graphed in a different color so you can differentiate them. The table in the lower panel presents the following information for each application:
- Health Trend — Sparkline that graphically describes the recent health of the application.
- Throughput — How many Traces per Minute (tpm) were executed over the current time window.
- Errors —Percentage of Traces that resulted in an Error (HTTP status 500 to 600).
The graphical or tabular view of all applications is useful to see which applications have been busiest and to compare their relative health. Click in the graphs to see the application-specific information. Click the column headers in the table to sort the information based on the column.
Click on an application in the left Applications panel. The right panel displays similar information about the application as in the previous table, but this time the graph contains information only about the specific application and its End Points. The End Points panel displays the End Points associated with the application; the same list appears below the name of the application in the left Applications panel.
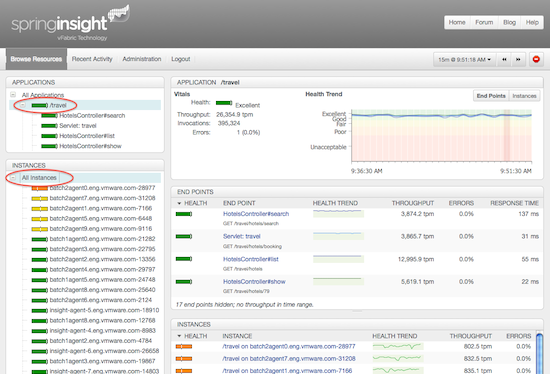
The Vitals section shows a summary of the health of the application.
Each row in the End Points table represents an End Point, which is a receptor for requests. The universe of all possible HTTP URLs is unlimited. However, Spring Insight can group requests together based on the controllers with which the requests are associated. For each End Point, Spring Insight displays the following information:
- Health—Shows how well the response time metric is kept within a tolerable threshold, where red is less healthy and green is more healthy. See Customizing End Point Thresholds for help setting the tolerable threshold.
- End Point— The name of the End Point.
- Health Trend— Simple sparkline that shows the recent health of the End Point.
- Throughput—Number of Traces per Minute (tpm) executed over the current time window.
- Errors— Percentage of Traces resulted in an Error (HTTP status 500 to 600).
- Response Time—The 95% response time over the given time range. This value is useful to determine the worst-case request. A value of 115ms indicates that 95% of the requests completed within 115 milliseconds. The response time of an HTTP request is the full time the container takes to send the response to the client, not just the time spent in a controller.
Click on a particular End Point, either in the left Applications panel or in the right End Points table:
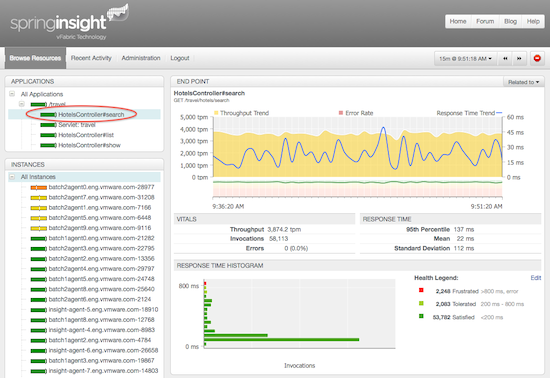
Spring Insight displays the following detailed information about the End Point:
- The End Point chart shows the
- throughput trend—the recent mean throughput time of the End Point over the time range
- response time trend— the mean response time of the End Point over the time range
- error rate—percentage of traces that resulted in an error. Hover over any spot in the chart to view details for the time slice represented by that section of the chart. Click on a data point to see trace data that occurred during that time range.
- The Vitals section displays the mean throughput, total number of Invocations, and errors for all of the traces in the time range represented on the current chart.
- The Response Time section displays statistics about the response times for all of the traces represented on the current chart. The 95th Percentile statistic indicates that 95 percent of requests completed within the indicated time period. The Mean is the average response time. The Standard Deviation is a measure of the variability of response times. A larger standard deviation indicates a greater variability in response times.
- The Response Time Histogram is an interactive graph that shows how many invocations occurred within a given time period. The Y-axis represents the response time of an invocation. The X-axis represents the number of invocations. Using the histogram is an easy way to identify outliers in your data. The longest-running invocations are always at the top of the histogram. If extreme outliers exist, they are indicated by red bars.
- The Health of the End Point is determined by the Response Time for requests made over the given time interval. The response times are broken down into various Health Zones (such as frustrated, tolerated or satisfied. Click on a particular Health Zone to see representative Traces within that zone.
- The End Point chart shows the
Click a bar in the histogram or on one of the markers in the Throughput or Response Time Trend graphs. A Representative Traces panel shows representative traces for some invocations that occurred during the selected duration.
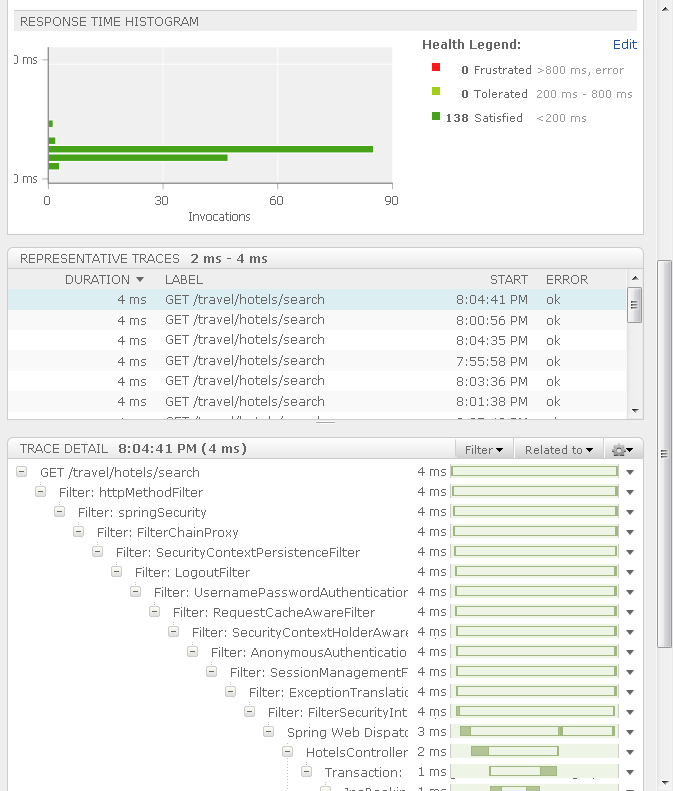
The Representative Traces panel includes similar data as that of the Recent Activity screen. From here it is easy to drill into the shortest or fastest running traces to see what made them different. See Viewing Recent Activity of Your Application for detailed information about traces and trace details.
Viewing Recent Activity of Your Application
The following procedure describes how to get an overview of the recent activity of a particular application, or for all applications currently deployed, and then how to drill down to the details of a particular application event.
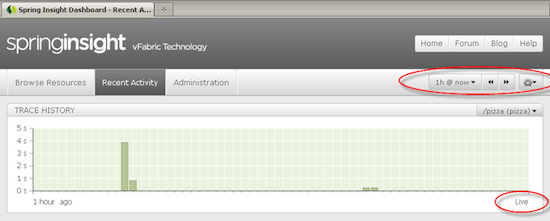
From the main Spring Insight dashboard, click the Recent Activity tab:
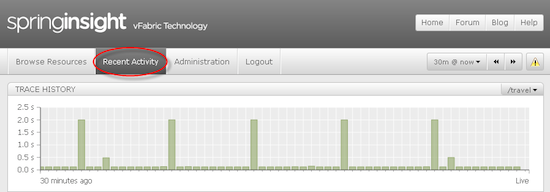
The Recent Activity screen displays traces from your application. A trace is a breakdown of the activity of a request. The Recent Activity screen answers the question What just happened?
In the top-right Application Selector drop-down box, select the name of your application.
Use the Application Selector to view activity for all applications or for just a single one. Viewing all applications at once is useful when you deploy many Web applications and are interested in activity across the entire set. Viewing a single application filters out activity not related to that application.
The Trace History panel shows a timeline of the recent activity of your application as real-time requests, represented by bars in the chart. Each bar represents all requests that occurred within a time slice, as measured by the chart. The full time range has 60 time slices. The height of the bar is equal to the longest request that occurred during that window.
The Trace History graph shows activity that Spring Insight has monitored over the past N minutes. When Spring Insight captures a trace, it draws a new bar on the graph on the right-hand side. As time passes, bars move left until they fall out of the time range.
Click on bars to drill deeper.
Click on a bar in the Trace History chart.
Spring Insight displays a list of traces in the Traces panel that executed during the window of time (or time slice), and then details about a specific trace. Spring Insight automatically shows details about the first trace in the Trace Details panel. If you click on a different trace, Spring Insight refreshes the details panel with corresponding information.
The Spring Insight dashboard shows the Traces and Trace Detail panels.
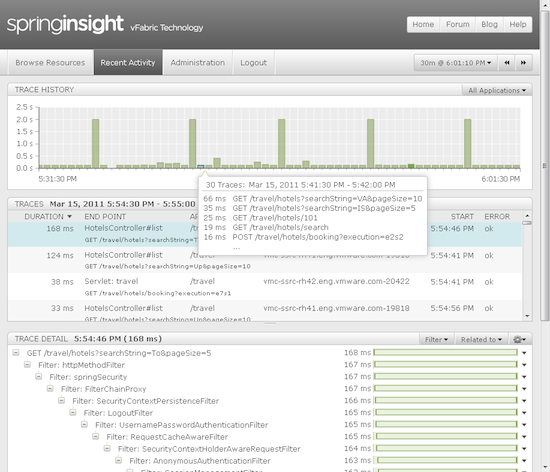
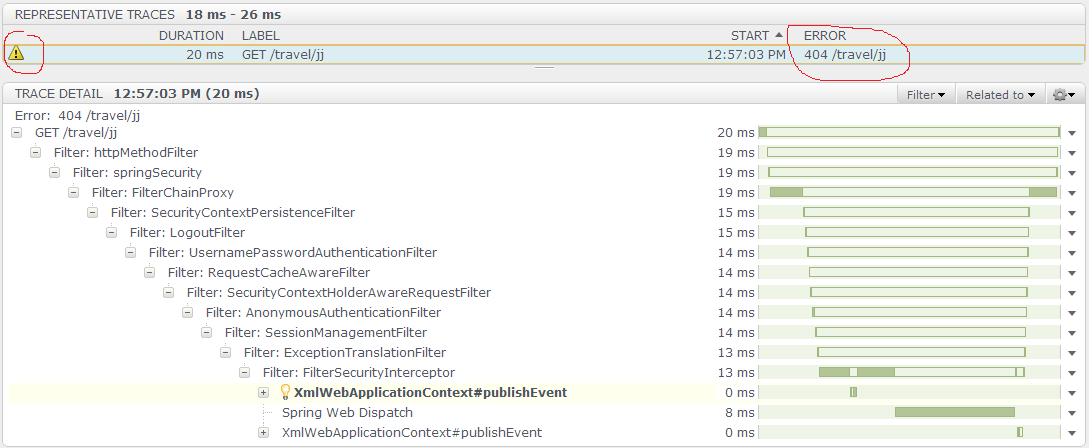
You can sort the traces in the Traces panel by Duration (how long did the trace take?), Label, Start (when did the trace start?), End Point (what was the request?), or Error (did the request result in an error?)
Click on a trace in the Traces panel to view its details in the Trace Detail panel.
The Trace Detail panel contains a breakdown of a trace's activity in a tree format. A trace consists of a top-level operation, usually a Web request, and all nested operations.
Spring Insight uses "smart collapse" to determine how to collapse the tree of trace details so that you do not get pages and pages of trace information. You can, of course, uncollapse operations to drill down into their details.
Operations are the fundamental building blocks of traces. An operation can represent a Web request, a transaction, a call to an MVC controller, a file opening, a service request, and so on. Each operation may have other operations nested within it. The nesting structure shows the normal stack-based method invocation pattern.
The operation timing graph shows two pieces of information:
- When the operation executed in relation to the other operations. This information shows whether the operation executed towards the end of the request or the beginning by the location of the green bar in relation to its borders.
- How long the operation took to execute, indicated by the width of the green bar. Because operations can be nested within operations, the green bar shows only how long the particular operation took, not the sum of duration of the nested operations. This way you can scan all the nested operations and find the particular one that took the longest time, based on the width of its green bar.
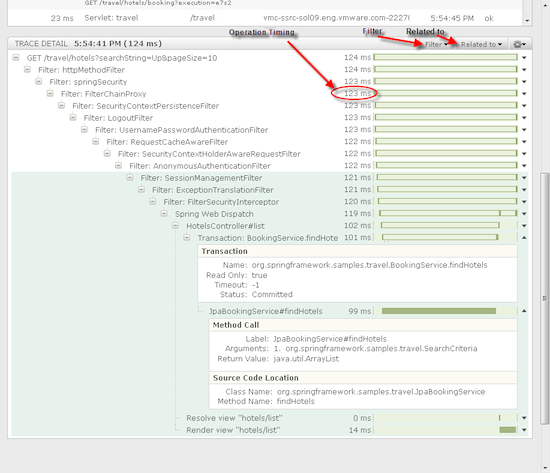
Click on an operation's label, or the entire row, to drill further into the operation details. The details of this panel are specific to each type of operation, and contain the finest granularity of collected data.
Click on Filter to filter the trace details shown in the panel. See Filtering Trace Details for additional details about this feature.
Click on Related To to navigate to the Trace's corresponding End Point or application in the Browse Resources tab. This button is useful when you want to see how similar requests (requests to the same End Point or application) have performed over time.
Visual indicators:
- A lightbulb icon gives a visual explanation to how each trace is classified as belonging to a specific endpoint. For example, in the screenshot below, the frame representing the
HotelsControllersearchmethod is selected as the most important frame in the trace. - A bar above the trace detail pane displays details of an http request that resulted in an error.
The buttons above the Application Selector help you control the information you see in the Spring Insight dashboard and perform additional administrative tasks:
- Change the global time range using the first drop-down list. The time range specifies how many minutes worth of data shows up in the Trace History graph.
- Play or pause the graph movement by specifying
noworpausein the first drop-down list. If the graph is in Play mode, the wordLiveappears under the right hand side of the graph. If you have paused the graph movement, the time when you clicked the pause button appears instead. - Click the
<<or>>buttons to rewind or fast-forward, based on the specified time ranges. Spring Insight persists all trace information about all your applications to disk, which means you can rewind and look at trace information from when you first began to track the performance of your application. - In the right-most drop-down list, choose
Refreshto refresh the trace history by reloading all data within the Trace History graph.
Filtering Trace Details
Depending on the nature of a specific trace, the list of operations in the corresponding Trace Detail pane might be very long. Spring Insight uses smart collapse, which means it collapses those operations it thinks are unimportant but expands operations that are most likely interesting to you. However, the Trace Details pane could still be very large. In this case, you might want to filter the list of operations to display only certain types that interest you.
The list of available filters depends on the plug-ins currently installed in Spring Insight as well as the type of operations in the current list of trace details. Spring Insight has a number of plug-ins installed by default. Click the Administration tab on the main dashboard then Collection Plug-Ins to see the list. If you have previously added your own custom plug-in to Spring Insight so as to display custom trace details, then this filter might also be available.
The default list of filters is as follows:
- Database: Filters operations based on whether they are related to general database calls. This could include transactions as well as standard calls to a relational database, for example.
- JDBC: Filters operations based on whether they are JDBC calls. The results of this filter are a subset of the results of the Database filter.
- Servlet: Filters operations based on whether they are Servlet operations, including operations such as authentication, session management, and handling requests and responses.
- Web: Filters operations based on whether they are related to Web calls, such as HTTP requests and responses, rendering of HTML pages, and so on. The results of this filter are a subset of the results of the Servlet filter.
Filters are tri-state—you can set each filter to one of three different states:
- Unselected – operations are included in the results unless one or more other filters are set to + (plus)
- + (plus sign) – only these operations are included in the results
- - (minus sign) - only these operations are excluded from the results
Filters are sticky, which means that they stay in place even when you navigate away from the page in which you set the filter. This is useful if you want to look at multiple applications or End Points, searching for JDBC calls, because you do not have to reset the filter each time you look at a different trace. You can remove the filter at any time, as described in the procedure below.
To use filters, follow these steps:
Display the Trace Details pane for a particular trace you are interested in. See Viewing Recent Activity of Your Application.
In the top-right corner of the Trace Details pane, click the Filter drop-down list and select the filters you want to apply. You can select multiple filters; the results are a sum of the individual filter results. Set the filter to + (plus) to include only those operations, - (minus) to exclude the operations, or leave the box unselected. If you do not set a filter to + or -, the operations are included unless another filter is set to +.
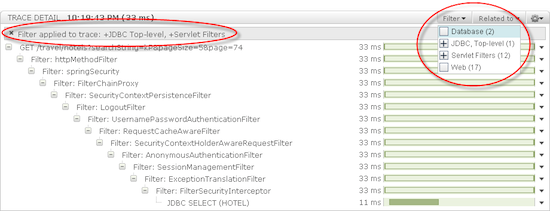
Click to the left of the Filter drop-down list to actually apply the filter. A message appears below the Trace Detail label to alert that a filter is being applied.
After applying the filter, the trace details navigation tree is smaller, and only details included meet the specified filter conditions.
Because of the stickiness of the filter, as you navigate away from your current page you'll notice that Spring Insight continues to apply the filter.
To remove the filter, click on the
Xto the left of theFilter applied to tracealert.
Exporting and Importing Traces
With this feature, you can export a trace to a file and then import it into either the same or different instance of Spring Insight. This feature is useful if the Spring Insight user who captured the trace in real time wants to look at it at a later time, or hand it off to another person.
For example, assume that a QA engineer is testing their company's Web application and runs into an error, or an operation takes an excessive time to complete. The QA engineer uses Spring Insight to take a look at what just happened by navigating to the relevant trace and viewing its details. If the QA engineer decides to open a bug about the problem, they can export the trace to a file and then attach this file to the bug issue so that the developer can take a look at a later date. The developer does not need to actually deploy the application; rather, they can look at the trace details to figure out which operation caused the error, where the excessive time occurred, and so on. This is an easy way to capture a complete set of trace information about an error event, even if the event is not reliably reproducible.
You can only import traces that were previously exported from a Spring Insight instance.
To export a trace:
- Display the Trace Details pane for the particular trace you want to export. See Viewing Recent Activity of Your Application.
- From the right-most drop-down list in the Trace Details pane
 , select Export Trace:
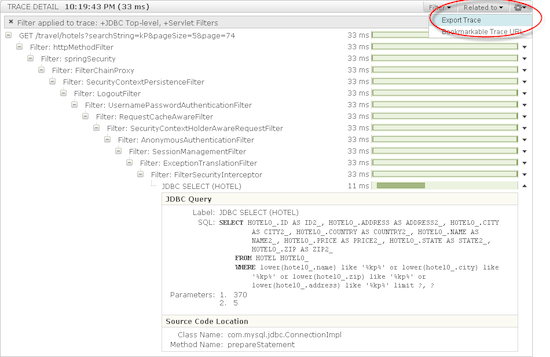
- Save the exported trace to a file. The name of the file will be of the form
trace-identifier.insight.
To import a trace:
- From the main Spring Insight dashboard, click the Administration tab.
- In the left pane, click Import Trace.
- In the right pane, use the browse button to browse the trace you want to import; the name of the file will be of the form
trace-identifier.insight. - Click Import.
- Spring Insight immediately takes you to the Recent Activity page with the trace and its details displayed. To locate the trace in the Trace History pane, go back in time to when the trace was originally exported.
Customizing End Point Thresholds
The health of an End Point is based on how many traces took longer to execute than the response time threshold.
By default, Spring Insight uses a response time threshold of 200ms. In the response time histogram, the upper limit of the y-axis is 4-times the threshold, or 800ms by default. The time chunks of the y-axis are not evenly distributed, but rather, broken up in a way to show the distribution of the response times of the recent End Point traces.
If, for a given trace or subset of traces, you find that the default threshold is too high or too low, you can change it. For example, if you find that all your response times for the .*show.* methods are almost always below 100ms, you might want to set this as the threshold. The histogram will then have a smaller range, and thus show more fine grained information. Similarly, if you have an end point in which the response times are always over 200ms, the health of this end point will almost always show as frustrated. If you decide that it is acceptable if a threshold of 300ms is acceptable, then you can change it for this End Point so it will show as appropriately healthy.
In other words, when you change the response time threshold for an End Point, you change the criteria that Spring Insight uses to decide whether it is healthy or not.
The following graphic shows the health and response time histogram for an End Point whose threshold is the default (200ms):
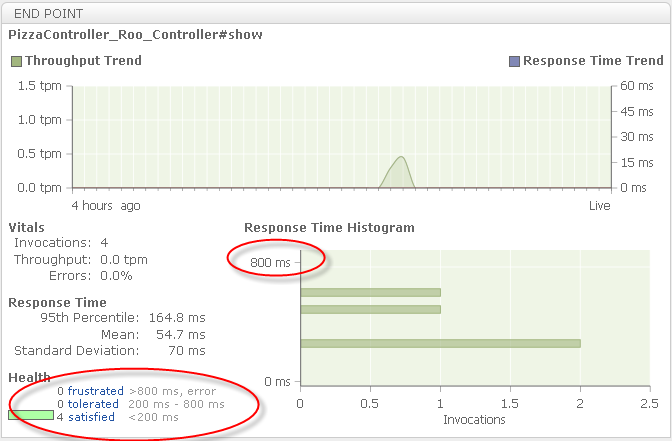
The upper limit in the histogram of 800ms, and the satisfied range is under 200ms. A response time of over 200ms but under 800ms is tolerated, but over 800ms is frustrated, or unhealthy.
All response times are under the default threshold so the End Point is healthy. If the response times are all significantly below the default threshold, it might be a good candidate to lower the threshold to get more fine-grained response time information.
To change the threshold for an End Point or set of End Points:
- From the main Spring Insight dashboard, click the Administration tab.
- Click End Point Thresholds in the left pane.
- In the right pane, click New:
- In the Rule field, enter a regular expression that corresponds to the End Point or End Points for which you want to change the threshold. For example, if you want to specify all
showmethods, enter.*show.*: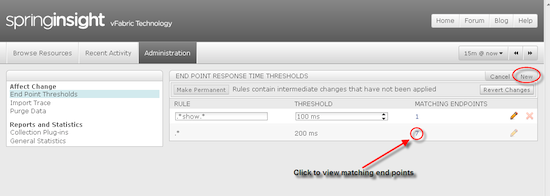
- Enter the new threshold. As described above, the default Spring Insight threshold is
200milliseconds. - Click the pencil icon. The new rule appears in the table. The Matching End Points column shows the number of End Points that match this rule; the number is a link. Click on this link to see the list of matching End Points.
- Click Make Permanent to apply your changes.
- If you have three or more rules, you can use the up and down arrow buttons to change the order in which Spring Insight applies the rules. Spring Insight applies the rules from first in the list to last. The default rule (
.*) should always be last, since it matches all end points.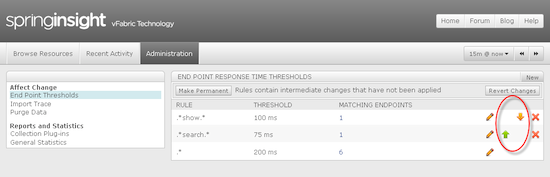
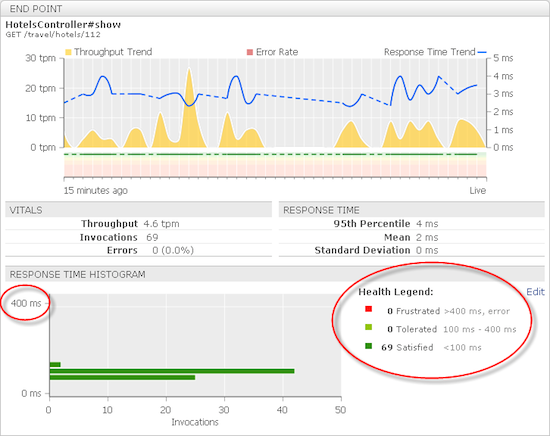
- Browse to a trace that matches the rule. Note that the y-axis of the Response Time Histogram now has an upper limit of 4-times the new threshold. The health of the End Point is now satisfied when its response time is below the new threshold. In our example, the new threshold is 100ms and so the upper limit is 400ms:
Viewing Spring Insight Data In Google Speed Tracer
Speed Tracer is a Google Chrome extension that analyzes how your application is performing inside the browser. It measures how long the browser takes to render, transform CSS, show images, process events, and so on.
Although Speed Tracer is a great tool for determining where CPU time is spent within the browser process, it cannot see into what the application itself is doing in the back end. For that, it needs Spring Insight. The two products are now integrated so that you can now see Trace data interleaved with Speed Tracer's browser timings.
To see Spring Insight Trace data within Speed Tracer for an application deployed to Spring Insight, follow these steps:
- Deploy your application to a tc Runtime instance that is configured with Spring Insight.
- If you have not already done so, download the version of Google Chrome that has been instrumented for Speed Tracer, install the Speed Tracer extension, and launch the Chrome browser with the appropriate flag. For details, see Getting Started with Speed Tracer.
- Open up the Speed Tracer console by clicking on the stopwatch icon in the top-right corner of the Google Chrome browser.
- Using Google Chrome, navigate to a page of your deployed application and perform some action.
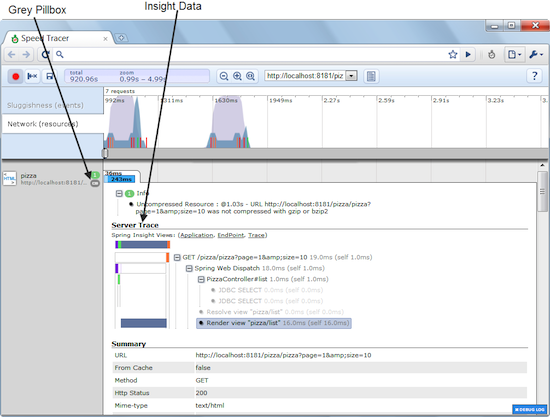
- In Speed Tracer, click on the Network (resources) timeline. In the left column, search for resources that have a grey pillbox, with tooltip
Includes timing data from the server; these resources include Spring Insight data along with the standard Speed Tracer data. See the graphic in the next step. - Expand the resource to view the Spring Insight data, listed under the Server Trace section. This section includes a brief summary of the Trace frame stack and allows easy navigation into various parts of Spring Insight related to the given Trace. To see more detailed information, select the Trace, End Point or Application links, which will jump into Spring Insight at the appropriate location so you can further drill down.
Using Annotations To Customize Spring Insight Data For Your Application
Spring Insight is implemented as a collection of plug-ins, each of which exposes specific types of method calls. Spring Insight includes a default set of core plug-ins that expose a broad set of information about your application. For example:
- The
insight-springcoreplug-in allows all methods in your application that have been annotated with the Spring Framework@Serviceor@Repositoryannotations to be traced by Spring Insight. - The
insight-jdbcplug-in allows all calls toPreparedStatement.execute()in your application to be traced by Spring Insight.
See Core Plug-In Reference for the full set of core plug-ins that are included by default in Spring Insight.
The default set of core Spring Insight plug-ins exposes useful information about applications in general. However, these plug-ins may not provide as much visibility into your particular application as you might like. In this case, you can add Spring Insight-specific annotations to the Java source of your application to inform Spring Insight that it should trace and expose one or more particular methods in your application. Currently, Spring Insight supports the following annotations:
- @InsightCustomEndpoint
- @InsightOperation
- @InsightEndPoint
- @InsightEndPointQualifier
- @InsightObscure
- @InsightSensitive
For a code example and a screenshot of Spring Insight annotations in action, see Example of Using the Spring Insight Annotations.
If you need to expose even more detailed information about your application, use the Spring Insight Developer Kit to create a plug-in tailored to the exact needs of your application. For details, see Overview of Spring Insight Development.
@InsightCustomEndpoint
Specify an InsightCustomEndpointGenerator implementation that gives you full control over the endpoint details (name, label, score, and so on) and even whether to generate an endpoint or not:
package foor.bar;

public class Baz {
   @InsightCustomEndpoint(MyBazEndpointGenerator.class)
   public void mySuperDuperMethod(int n, String s, Map<x,y> m) {
     ...
   }
}
package com.springsource.insight.annotation;

/**
 * Used to generate a custom endpoint analysis from intercepted annotated call
 */
public interface InsightCustomEndpointGenerator {
    /**
     * Used to inquire whether the intercepted call is generating and endpoint
     * @param target The target instance on which the method was invoked
     * @param method The invoked {@link Method}
     * @param args The runtime parameters values
     * @return <code>true</code> if an endpoint should be generated.
     * <B>Note:</B> if <code>false</code> then the other methods are not invoked
     */
    boolean isEndpoint(Object target, Method method, Object[] args);

    /**
     * Generates the endpoint name identifier
     * @param defaultName The default endpoint name generated by the framework
     * @param target The target instance on which the method was invoked
     * @param method The invoked {@link Method}
     * @param args The runtime parameters values
     * @return The endpoint name identifier - if <code>null/empty</code> then
     * the default name is used
     */
    String createEndpointName(String defaultName, Object target, Method method, Object[] args);

    /**
     * Generates the endpoint display label
     * @param defaultLabel The default label generated by the framework
     * @param target The target instance on which the method was invoked
     * @param method The invoked {@link Method}
     * @param args The runtime parameters values
     * @return The endpoint display label - if <code>null/empty</code> then
     * the default label is used
     */
    String createEndpointLabel(String defaultLabel, Object target, Method method, Object[] args);

    /**
     * @param target The target instance on which the method was invoked
     * @param method The invoked {@link Method}
     * @param args The runtime parameters values
     * @return The endpoint analysis score - if <code>null</code>, then the default
     * framework score will be used (i.e., reversed depth)
     */
    Integer calculateEndpointScore(Object target, Method method, Object[] args);
}
@InsightOperation
Specify that Spring Insight should display the annotated method and its arguments in the Spring Insight Traces. Use the optional label and comment attributes to customize the display, as described in the following table.
| Attribute | Description |
|---|---|
label |
Specifies what Spring Insight displays in the Trace frame stack for this method. A frame is the row in the Trace that you can expand or collapse so as to view more information about the method call. If you do not specify this attribute, Spring Insight uses the label |
comment |
Specifies additional information that you want Spring Insight to display when you expand the frame. If you do not specify this attribute, Spring Insight does not display any comment. |
@InsightEndPoint
Like @InsightOperation, use @InsightEndPoint to specify that Spring Insight should display the annotated method and its arguments in the Spring Insight Traces. Additionally, the annotated method is declared as an end point, which means that it shows up in the Browse Resource list as an end point. Use the optional label and comment attributes to customize the display, as described in the following table. String attributes can contain formatting modifiers that provide access to the intercepted endpoint "context".
package foor.bar;

public class Baz {
   @InsightEndPoint(name="{shortClassName}#{methodName}({signature})", label="Invoked {shortClassName}#{methodName}")
   public void mySuperDuperMethod(int n, String s, Map<x,y> m) {
     ...
   }
}
| Attribute | Description |
|---|---|
| label | Specifies what Spring Insight displays in the Trace frame stack for this method. A frame is the row in the Trace that you can expand or collapse so as to view more information about the method call. If you do not specify this attribute, Spring Insight uses the label |
| comment | Specifies additional information that you want Spring Insight to display when you expand the frame. If you do not specify this attribute, Spring Insight does not display any comment. |
| className | Fully qualified class name of the intercepted endpoint method, for example, foo.bar.Baz |
| shortClassName | Simple class name of the endpoint, for example, Baz |
| methodName | Intercepted endpoint method name, for example, mySuperDuperMethod |
| signature | Method parameters (simplified) types, for example, int,String,Map. |
| n | The value of the n-th parameter. Notes:
|
@InsightEndPointQualifier
Place @InsightEndPointQualifier on parameters of other intercepted APIs to append data to the default generated endpoint identifier. All string attributes allow access to the annotated parameter value via the '.' (dot) notation — with the same refinements as for the @InsightEndPoint annotation formatting modifier for a parameter value.
package foor.bar;

public class Baz {
   @InsightEndPoint
   public void mySuperDuperMethod(int n, @InsightEndpointQualifier(name="{.}", label="{.}") String s, Map<x,y> m) {
     ...
   }
}
@InsightObscure
Mark values that should be obscured before a trace is transmitted or stored. To obscure a parameter, annotate it:
 public int login(String username, @InsightObscure String password) {
    ... do work...
 }
To obscure a return value from a method, annotate the method:
 @InsightObscure
 public int getCCVNumber(AuthToken token) {
     ...
     return ccv;
 }
Obscured values are replaced with [xxx] or -1 (for numeric values) within the Trace. If two strings that are to be obscured overlap, the longer strings will be obscured first. e.g. "batman123" and "123456" are sensitive. The value "batman123456" will be changed to "[xxx]456"
@InsightSensitive Reference
Use @InsightSensitive to mark a method that processes sensitive data. Trace executions including this annotation will not be stored or visible in the Insight Dashboard. Metrics about the end point will still be collected.
 @InsightSensitive
 public int login(String username, String password) {
    ... do work...
 }
Example of Using Spring Insight Annotations
The following code snippet shows how to use the @InsightOperation and @InsightEndPoint annotations in a simple Hello servlet Java class; only relevant code is shown (in bold):
package examples;
...

import com.springsource.insight.annotation.InsightOperation;
import com.springsource.insight.annotation.InsightEndPoint;

/**
 * Simple Hello servlet.
 */

public final class Hello extends HttpServlet {

    @InsightOperation(comment="This is the InsightOperation comment",
                    label="doGet method of Hello class")
    @InsightEndPoint(comment="This is the InsightEndPoint comment",
                    label="doGet method of Hello class")

    public void doGet(HttpServletRequest request,
                      HttpServletResponse response)
      throws IOException, ServletException {
...
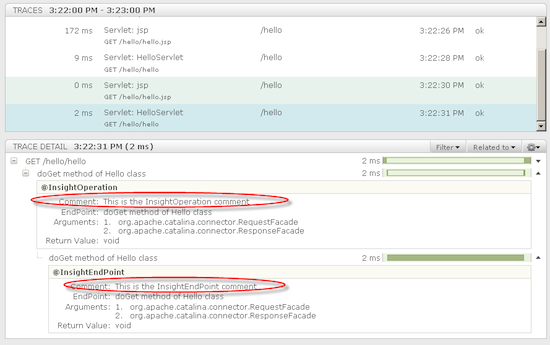
The example shows how to import the com.springsource.insight.annotation.InsightOperation and com.springsource.insight.annotation.InsightEndPoint annotations, then use them on the doGet method. The following graphic shows how the comments and labels show up in the Trace Details section of Spring Insight after the annotated method is executed:
Getting the Annotation JAR File
The Spring Insight container provides the insight-annotation-version.jar file at runtime, so you do not have to package this JAR file in your application. However, you do need this JAR file at compile time so you can successfully compile the Java classes in your application that uses the Spring Insight annotations.
If you use Maven to build your application, add the following XML (shown in bold in the snippet) to your pom.xml file to make the JAR file available to your project:
    <repositories>
      <repository>
        <id>spring-release</id>
        <name>Spring Repository</name>
        <url>http://maven.springframework.org/release</url>
      </repository>
      ...
    </repositories>

    <dependencies>
      <dependency>
        <groupId>com.springsource.insight</groupId>
        <artifactId>insight-annotation</artifactId>
        <version>1.8.3.RELEASE</version>
        <scope>provided</scope>
      </dependency>
      ...
    </dependencies>
Note that the preceding example depends on version 1.8.3.RELEASE of the Spring Insight JAR; when a new version releases, you should make the corresponding change in your pom.xml file.
If you use a build system other than Maven, you can download the annotation JAR file from the SpringSource community page and then add the file to your compile-time CLASSPATH variable.
Creating Dynamic Concrete Aspects
This section describes how to instrument classes and methods that are not covered by plugins. You create dynamic concrete aspects by editing the insight/collection-plugins/custom-aop/META-INF/aop.xml file.
<?xml version="1.0" encoding="UTF-8"?>
<aspectj>
    <aspects>
       <concrete-aspect name="foo.bar.BazAspect" extends="com.springsource.insight.collection.method.custom.CustomConcretizedOperationCollectionAspect">
           <pointcut name="collectionPoint" expression="execution(* foo.bar.Baz.mySuperDuperMethod(..))" />
       </concrete-aspect>
    </aspects>
</aspectj>
The following examples illustrate different definitions of the expression and the effect achieved by each.
Example 1
Monitor all public methods from any class that is annotated with @MyClassAnnotation:
execution(* (@foo.bar.MyClassAnnotation *).*(..))
Example 2
Monitor all public methods from any class ending in Impl that resides in the foo.bar package or any of its sub-packages:
execution(* foo.bar..*Impl.*(..))
Example 3
Monitor all public methods that are annotated with @MyMethodAnnotation from any class:
execution(@foo.bar.MyMethodAnnotation * *(..))
Example 4
Monitor all public login methods that accept two String parameters and that are implemented by MyClass or any class that extends it:
execution(* foo.bar.MyClass+.login(java.lang.String,java.lang.String))
Notes -
- The preceding samples are just examples of the instrumentation you can implement with dynamic concrete aspects. See AspectJ documentation for more information.
- You cannot refer to the values of intercepted methods arguments, format them, or parse them. Nor can these values be formatted and parsed for extra useful information (at least not via this mechanism; look at the Insight annotations for this purpose).
- Instrument only public methods with this tool. Do not instrument constructor executions, static initializers, or field access, even though AspectJ enables this. The result of straying from this recommendation is unknown.
- You can define several aspects in this file, each a separate <concrete-aspect> element.
- It is possible to assign a score to the endpoints generated by the aspect by using a collection setting named insight.collection.custom-aop.XXX.score, where XXX is the simple aspect name (in effect, the name after stripping the package name). The supported values are:
default. The endpoint's score is based on its location in the trace tree. The higher up the tree the intercepted API is found the higher its score, and it is more likely to become the representative endpoint for the trace. This also the default scoring if no setting is specified.minimum. A "catch-all" score that indicates that if no other "better" endpoint is found, then the intercepted API is the endpoint.top. Trumps the minimum score.ceiling. Trumps the top score.nnnn. A fixed integer value; if positive, it trumps any of the other scores (except other higher positive ones). Note: Negative values are reserved for internal use and should not be used.
- You cam control the generated endpoint name, label, and example strings of the endpoint analysis phase using the
insight.collection.custom-aop.XXX.endPoint,insight.collection.custom-aop.XXX.resourceLabelandinsight.collection.custom-aop.XXX.examplecollection settings. These values can also include dynamic modifiers, such as the class/method name, signature and argument values. See the Using Insight Annotations for the available modifiers and their meanings. - Any change to the XML file requires restarting the monitored application.
