


| VMware vRealize Network Insight 6.8 | 27 OCT 2022 | Build 1666364233 Check for additions and updates to these release notes. |


What's New
Here are the key features and capabilities of vRealize Network Insight 6.8:
New and Enhanced Home Page
The new Homepage now provides multiple widgets that present actionable insights.
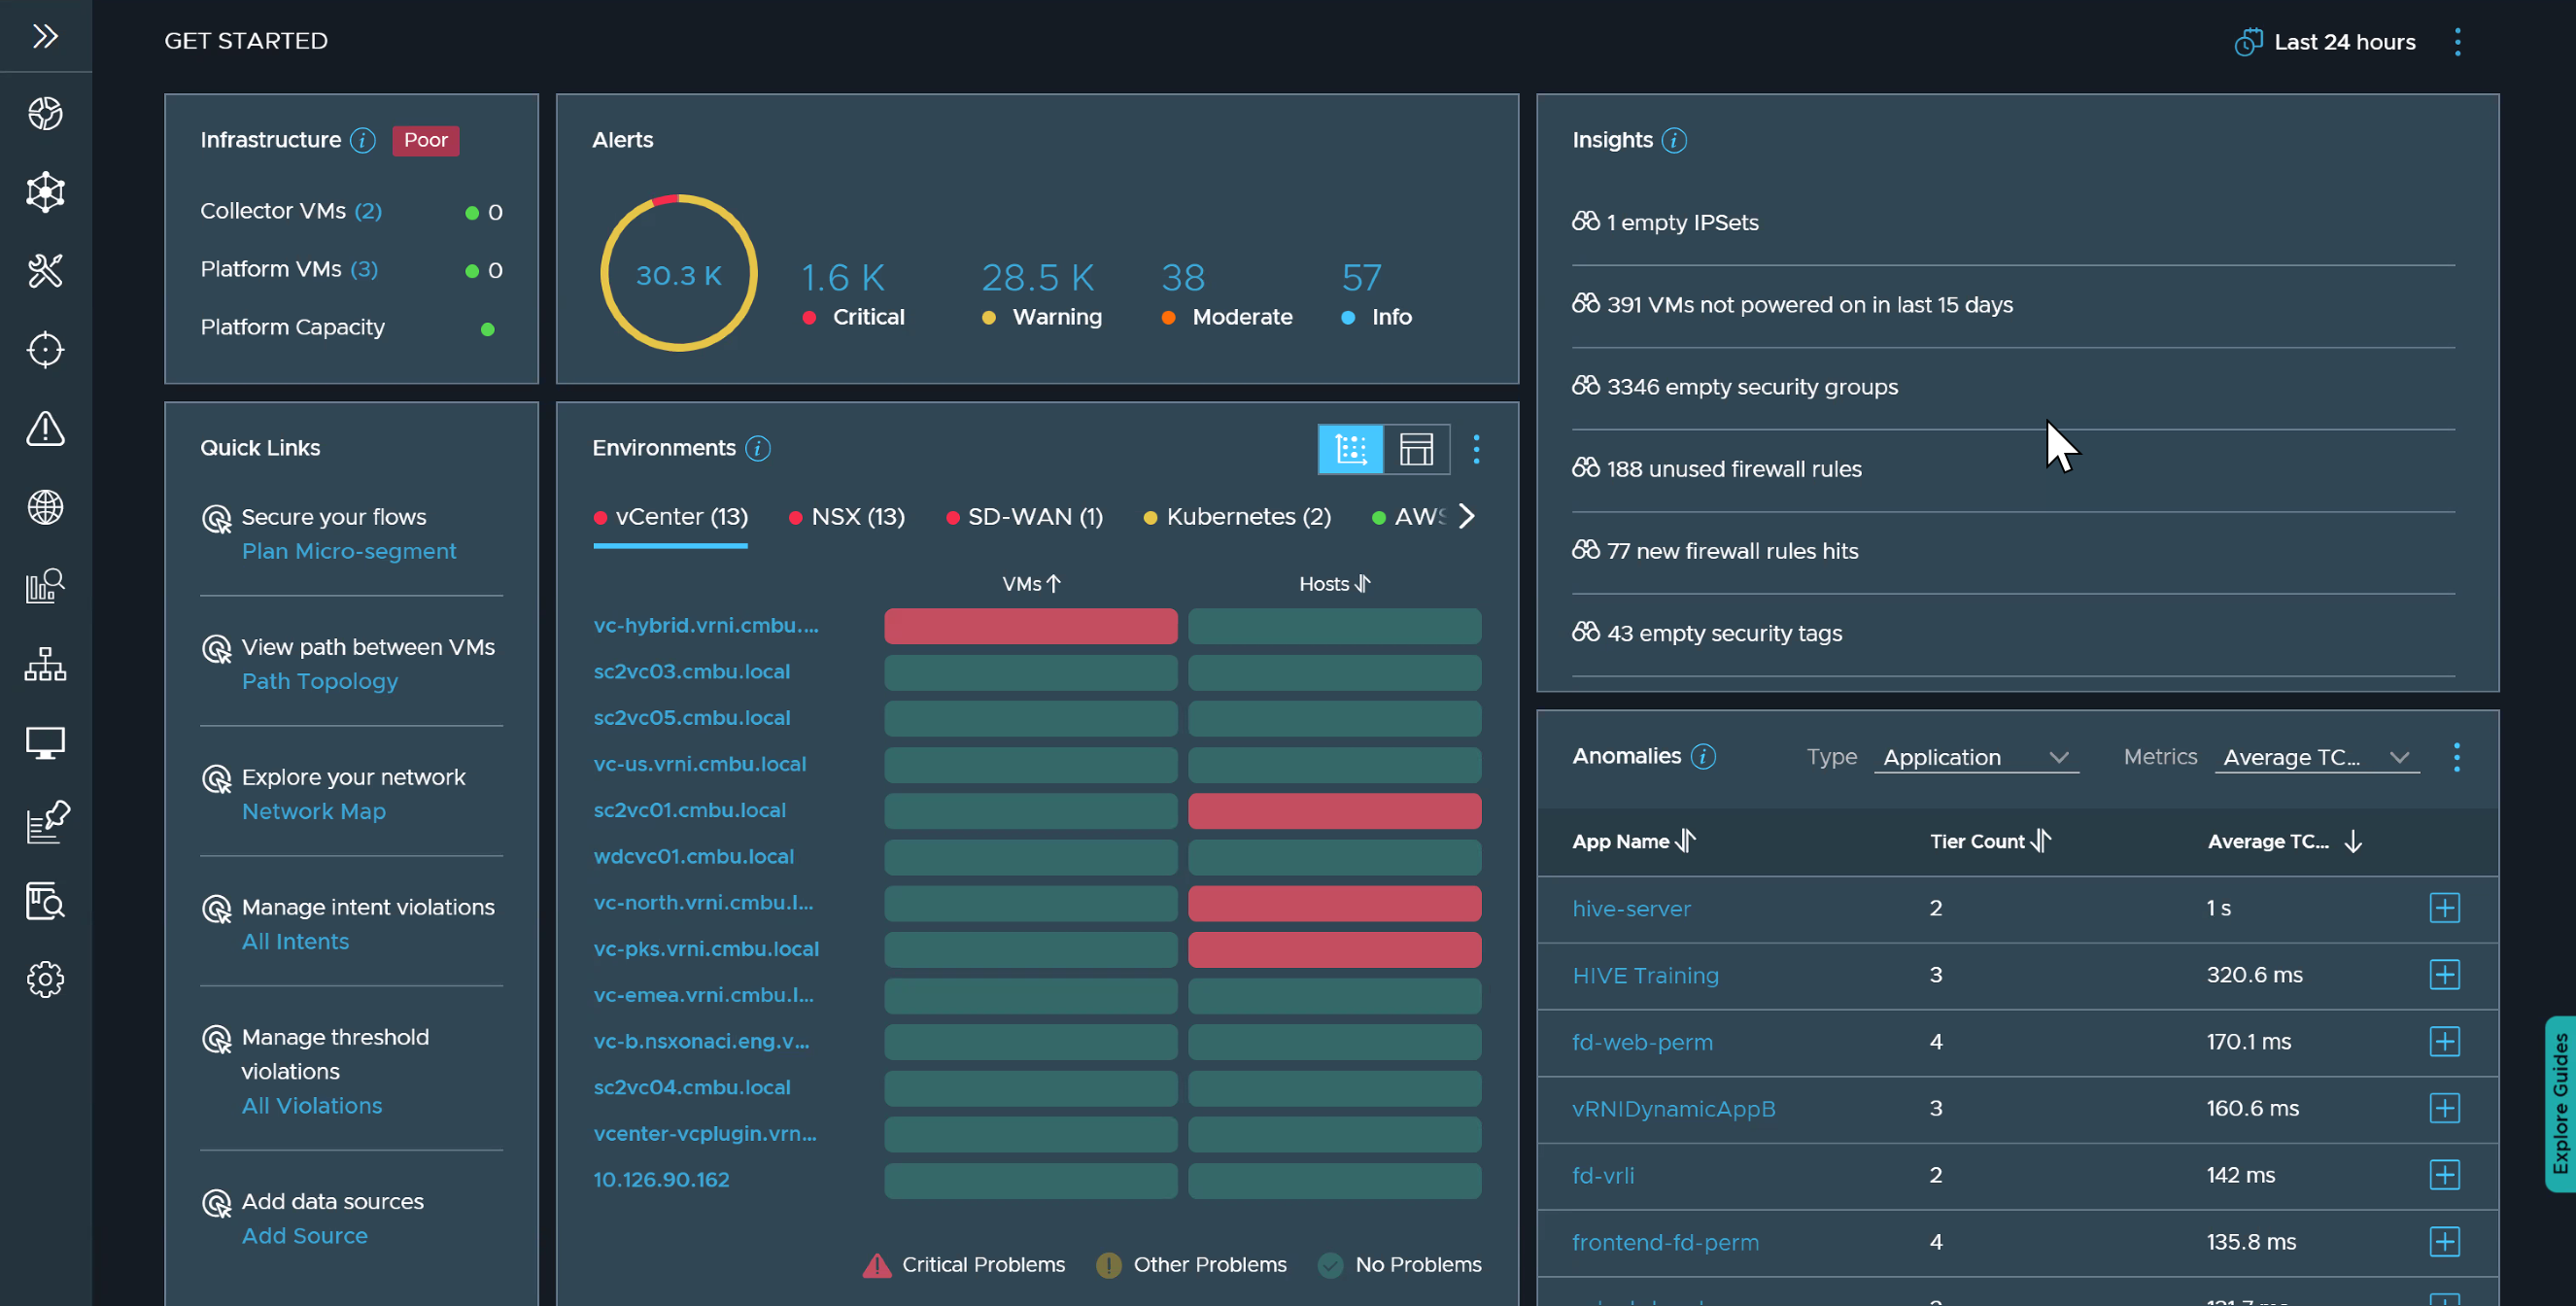
Some of the newly introduced homepage widgets are:
-
Network Insights Health: This shows the health of platform nodes, collector nodes, and platform capacity.
-
Environment Health: Shows the heatmap view of the environment and its health.
-
Alerts: Shows the alerts that are sorted by severity.
-
Quick Links: Shows useful quick links.
-
Insights: Highlights critical or behavioral changes in the network, provides an overview of the health of the applications and highlights firewall rules and VMs that need immediate attention.
-
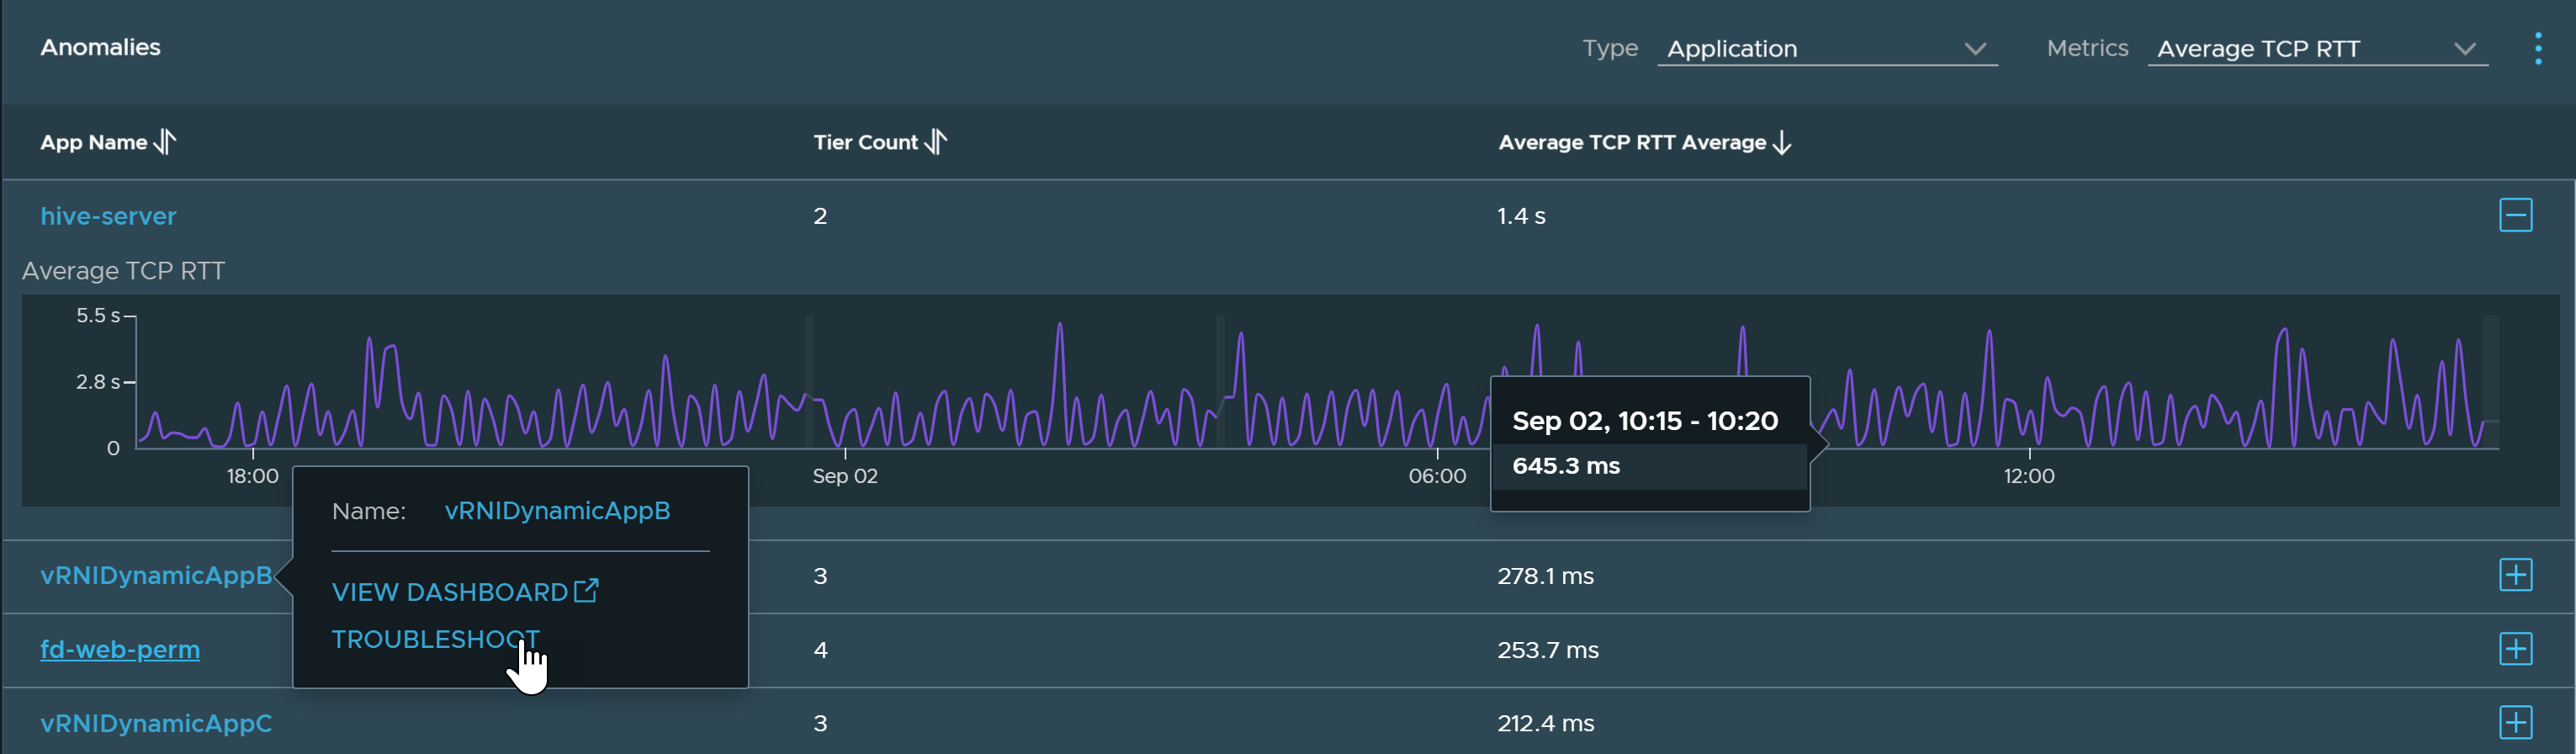
Anomalies: Shows error metrics for applications, VMs, and VMware NSX-T Edge Transport nodes.
-
You can use the metric graph on this widget to view trends.
-

-
You can also start troubleshooting issues (if any) by clicking the Troubleshoot button directly from the widget.
Network Assurance and Verification
The Link MTU Mismatchintent now provides you with several options to adjust or tolerate maximum transmission unit (MTU) offset sizes. These options enable you to ignore minor MTU differences based on your device vendor. You can:
-
Adjust the tolerance threshold for non-Jumbo (standard) MTU
-
Adjust the tolerance threshold for jumbo MTU
-
Turn off the MTU mismatch check if the VMware ESXi host interface MTU is lower than the switch interface MTU.

The following intents and errors are enhanced to be more robust and do not trigger false positives for the following scenarios:
-
The Duplicate IP intent does not trigger false positives for:
-
Dual-homed endpoint Multi-Chassis Link Aggregation (MLAG) in Arista devices.
-
Loopback interfaces configured with Anycast addresses.
-
-
The Duplicate MAC Address intent does not trigger false positives for High Availability (HA) pairs in Palo Alto Networks Panorama devices.
-
The HSRP/VRRP Configuration mismatch error does not trigger false positives for:
-
Multiple HSRP/VRRP groups with the same load balancer IP address set.
-
Arista VARP active-active pairs.
-
-
The Loop Detection intent now generates individual alerts for each loop found in the network to help you address these loops in sequence. Also, the alerts are visually enhanced to help detect the precise location of the loop and the devices involved in the loop.
ACI Contracts and Other Enhancements
-
Supports additional ACI contracts such as:
-
L3Out EPG
-
EPG to L3Out contract in VRF
-
EPG to L3Out contract between VRFs
-
L3Out in a common tenant and another VM in a different tenant.
-
-
Supports EPGs gateways in the ACI fabric for regular VM-to-VM path.
-
Supports path topology search involving both Cisco ACI and VMware NSX-T devices at the same time.
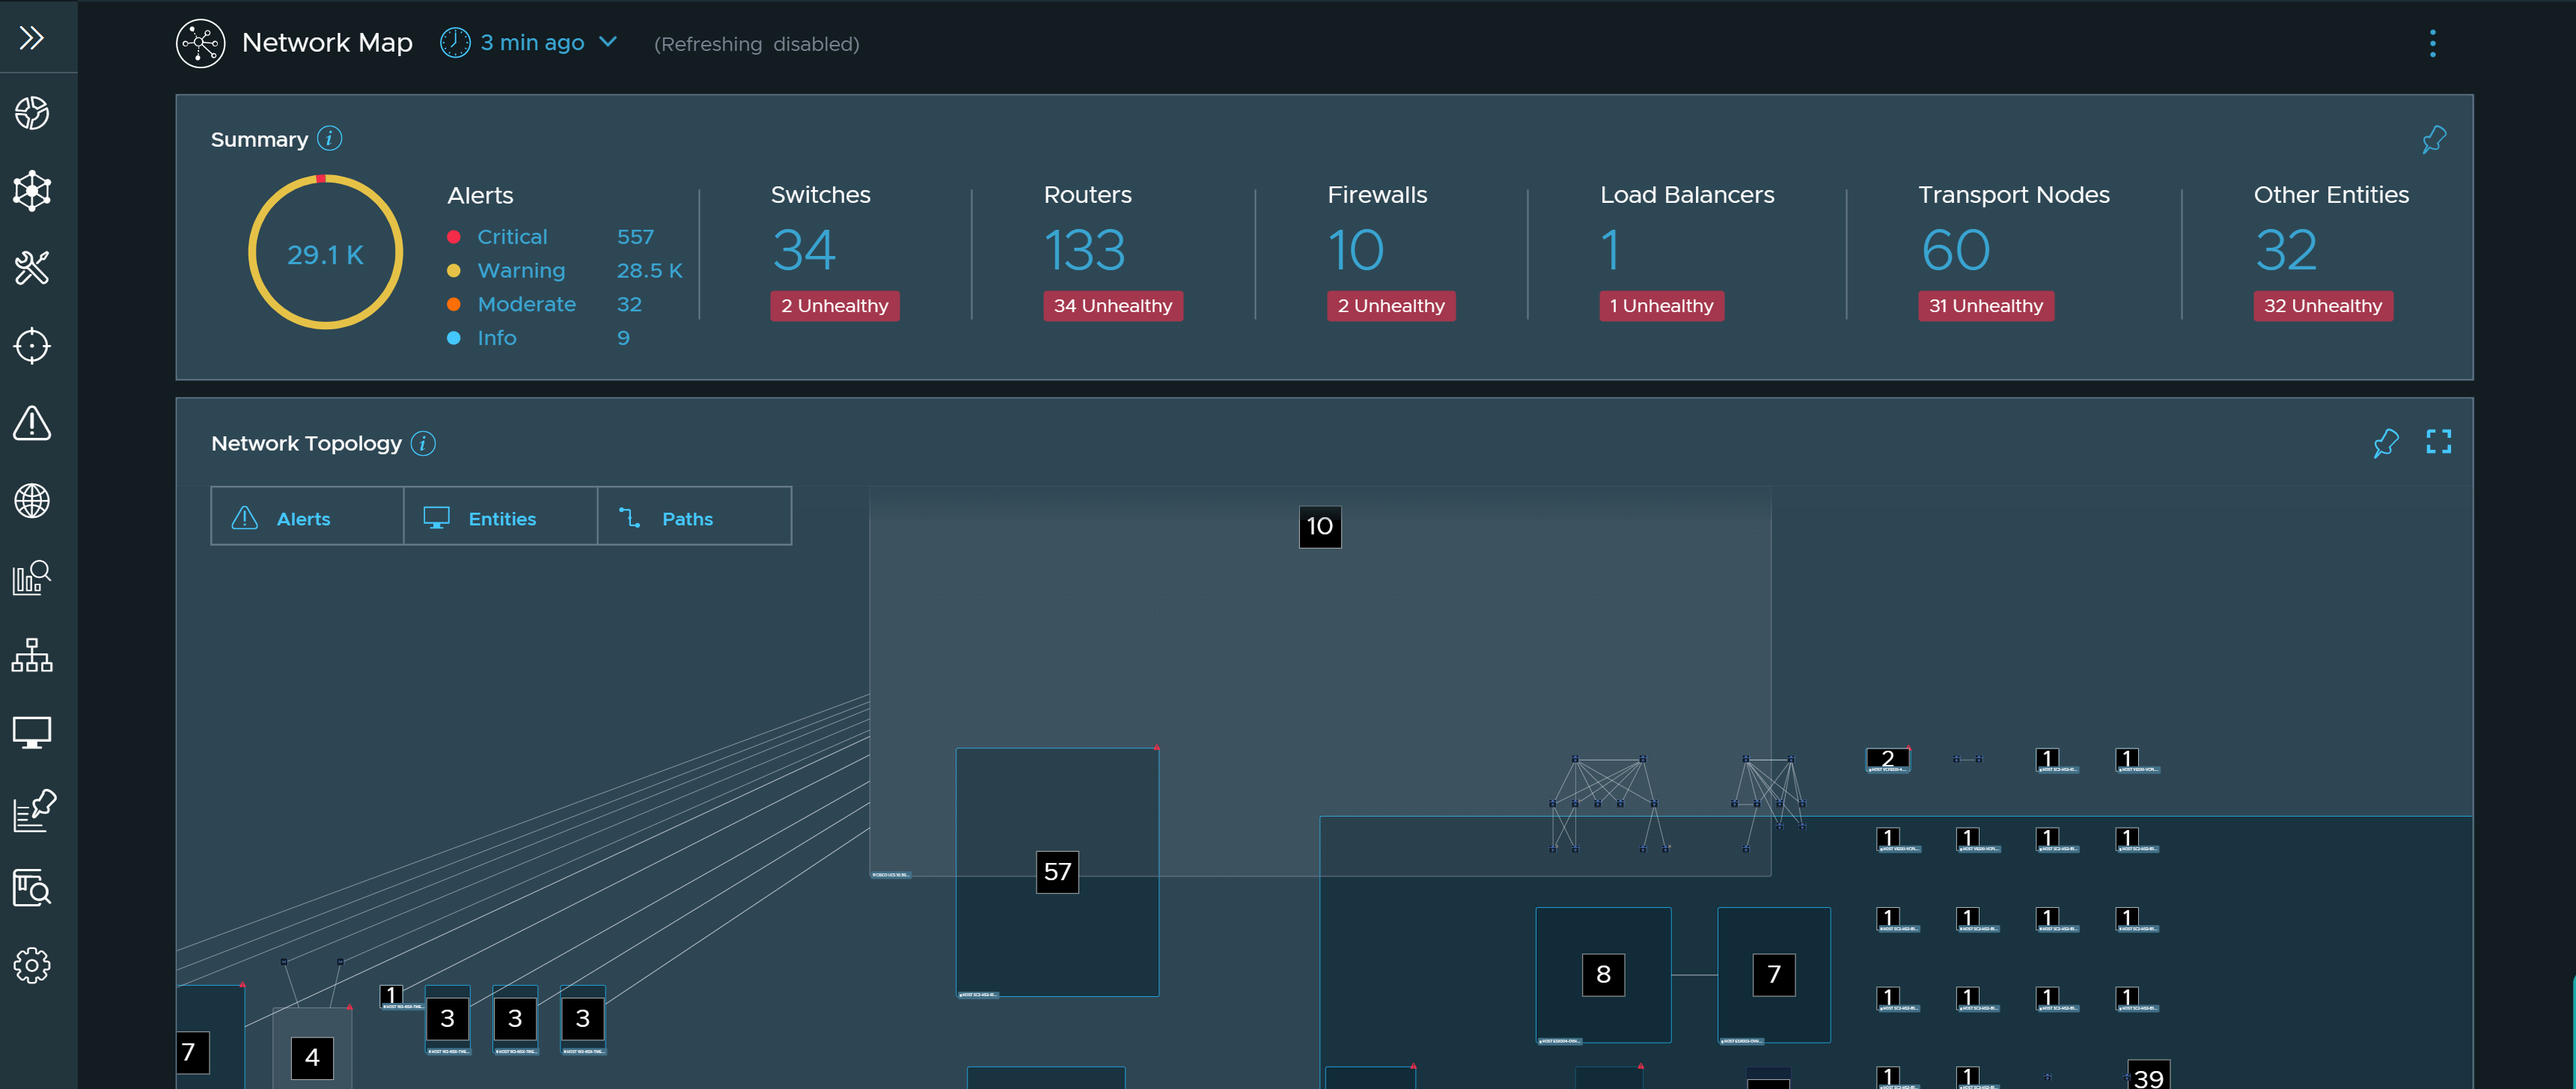
Network Map Enhancements
On the initial map load, Network Map now provides you with an overview of your network model, without displaying the finer details. The overview of the Network Map enables you to see information such as entity count within a group, broad network topology, and hotspots on your network.
-
Zoom in on a group to explore finer details of the group.
-
Experience smoother zoom in and zoom out without the need for Command or Control buttons to interact with the network map.
Applications page
The Applications page is enhanced with an overview dashboard to assist you in identifying applications that need attention. You can now see a summary widget on the page which provides a quick summary of applications that have alerts, intent failures, and security issues.
Each widget enables you to take appropriate proactive actions: Start guided network troubleshooting sessions that display performance-related issues or Start security planning workflows for security-related problems.
The applications page is further enhanced to provide:
-
Application changes in the last 24 hours which include newly discovered applications and applications requiring membership updates. Click on the number in the respective field to save or update the list of applications.
-
A new widget that shows information based on the type of application for on-premises, cloud, and hybrid.
-
Top 25 applications based on available metrics and alerts generated within vRealize Network Insight. Click on the respective application or a field to get directed to the respective troubleshooting or security workflow.

Application Intents
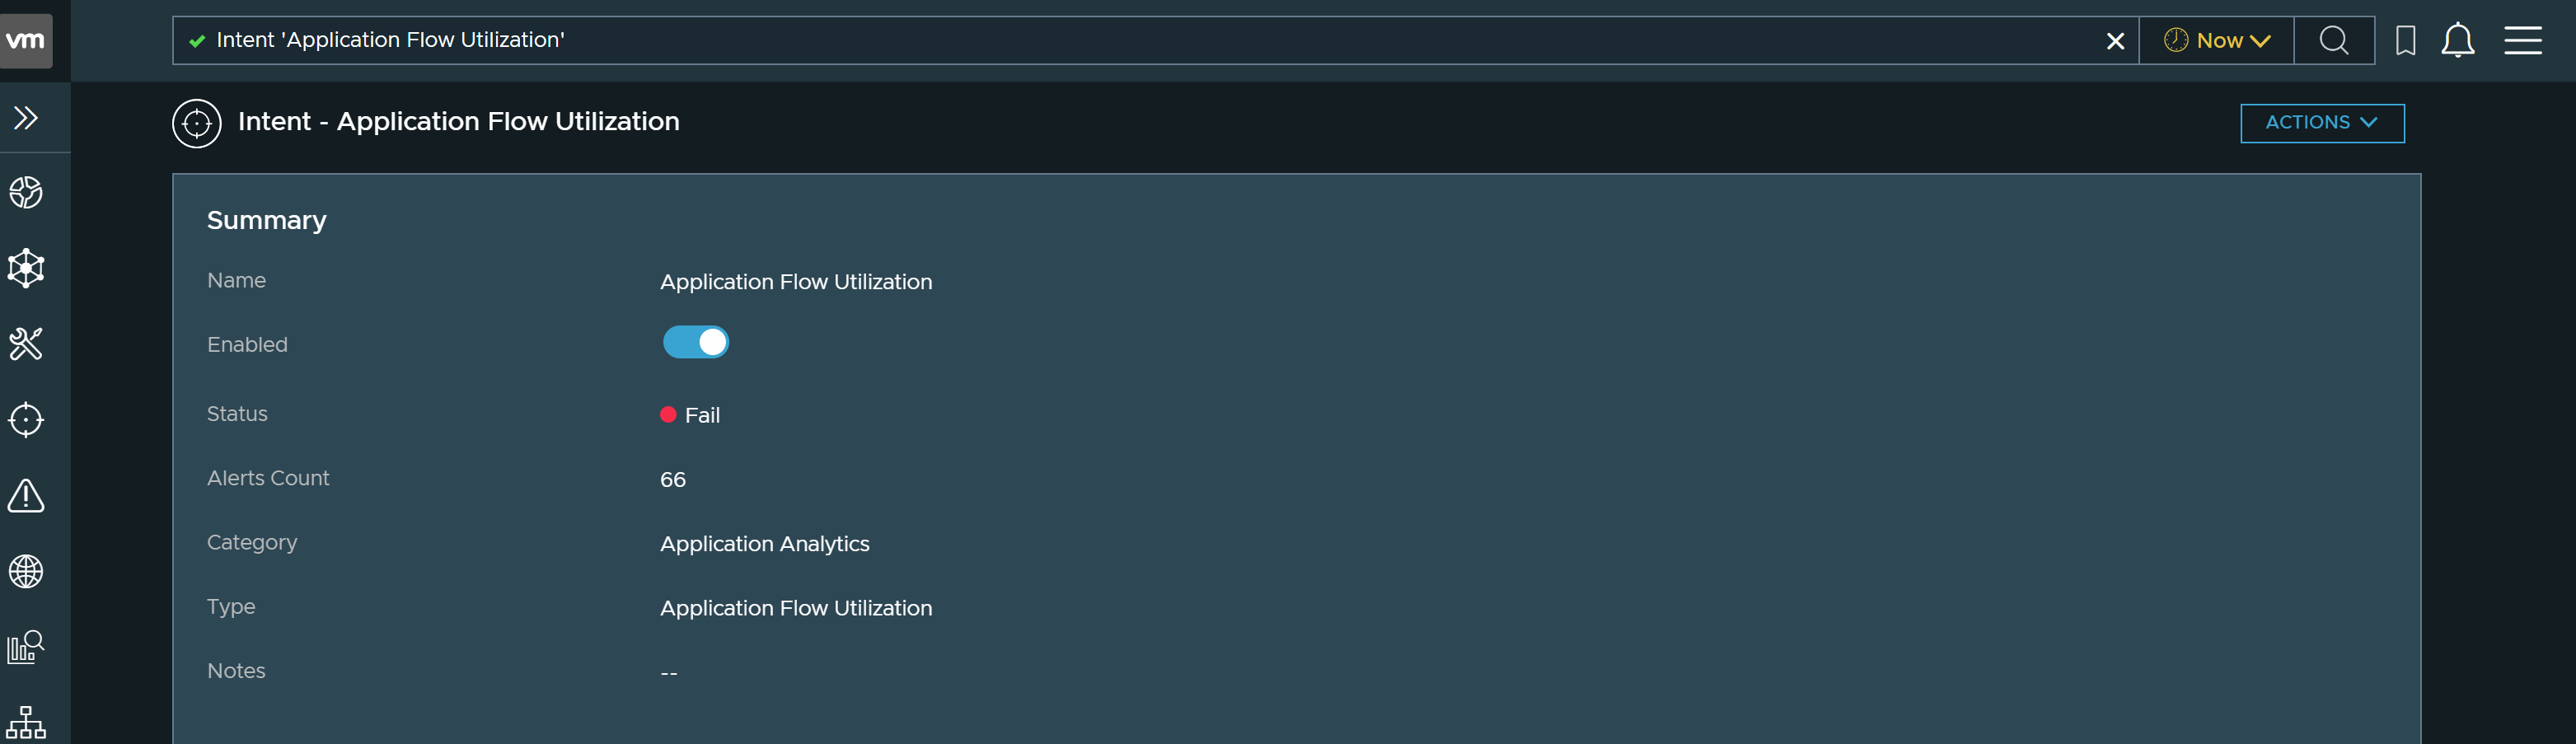
Threshold analytics are now converted into two application Intents:
-
Application Flow Health intent: This intent monitors the TCP round trip time and TCP retransmits to predict deviation in network behavior. In the event of a significant deviation for a period of 5 minutes, vRealize Network Insight generates a critical alert and displays an intent failure warning on the Applications page.
-
Application Flow Utilization intent: This intent monitors the existing traffic rate based analytics thresholds. In the event of a significant deviation of traffic rate for a period of 5 minutes, vRealize Network Insight generates a critical alert and displays an intent failure warning on the Applications page.
Unless deselected, application intents are enabled by default.
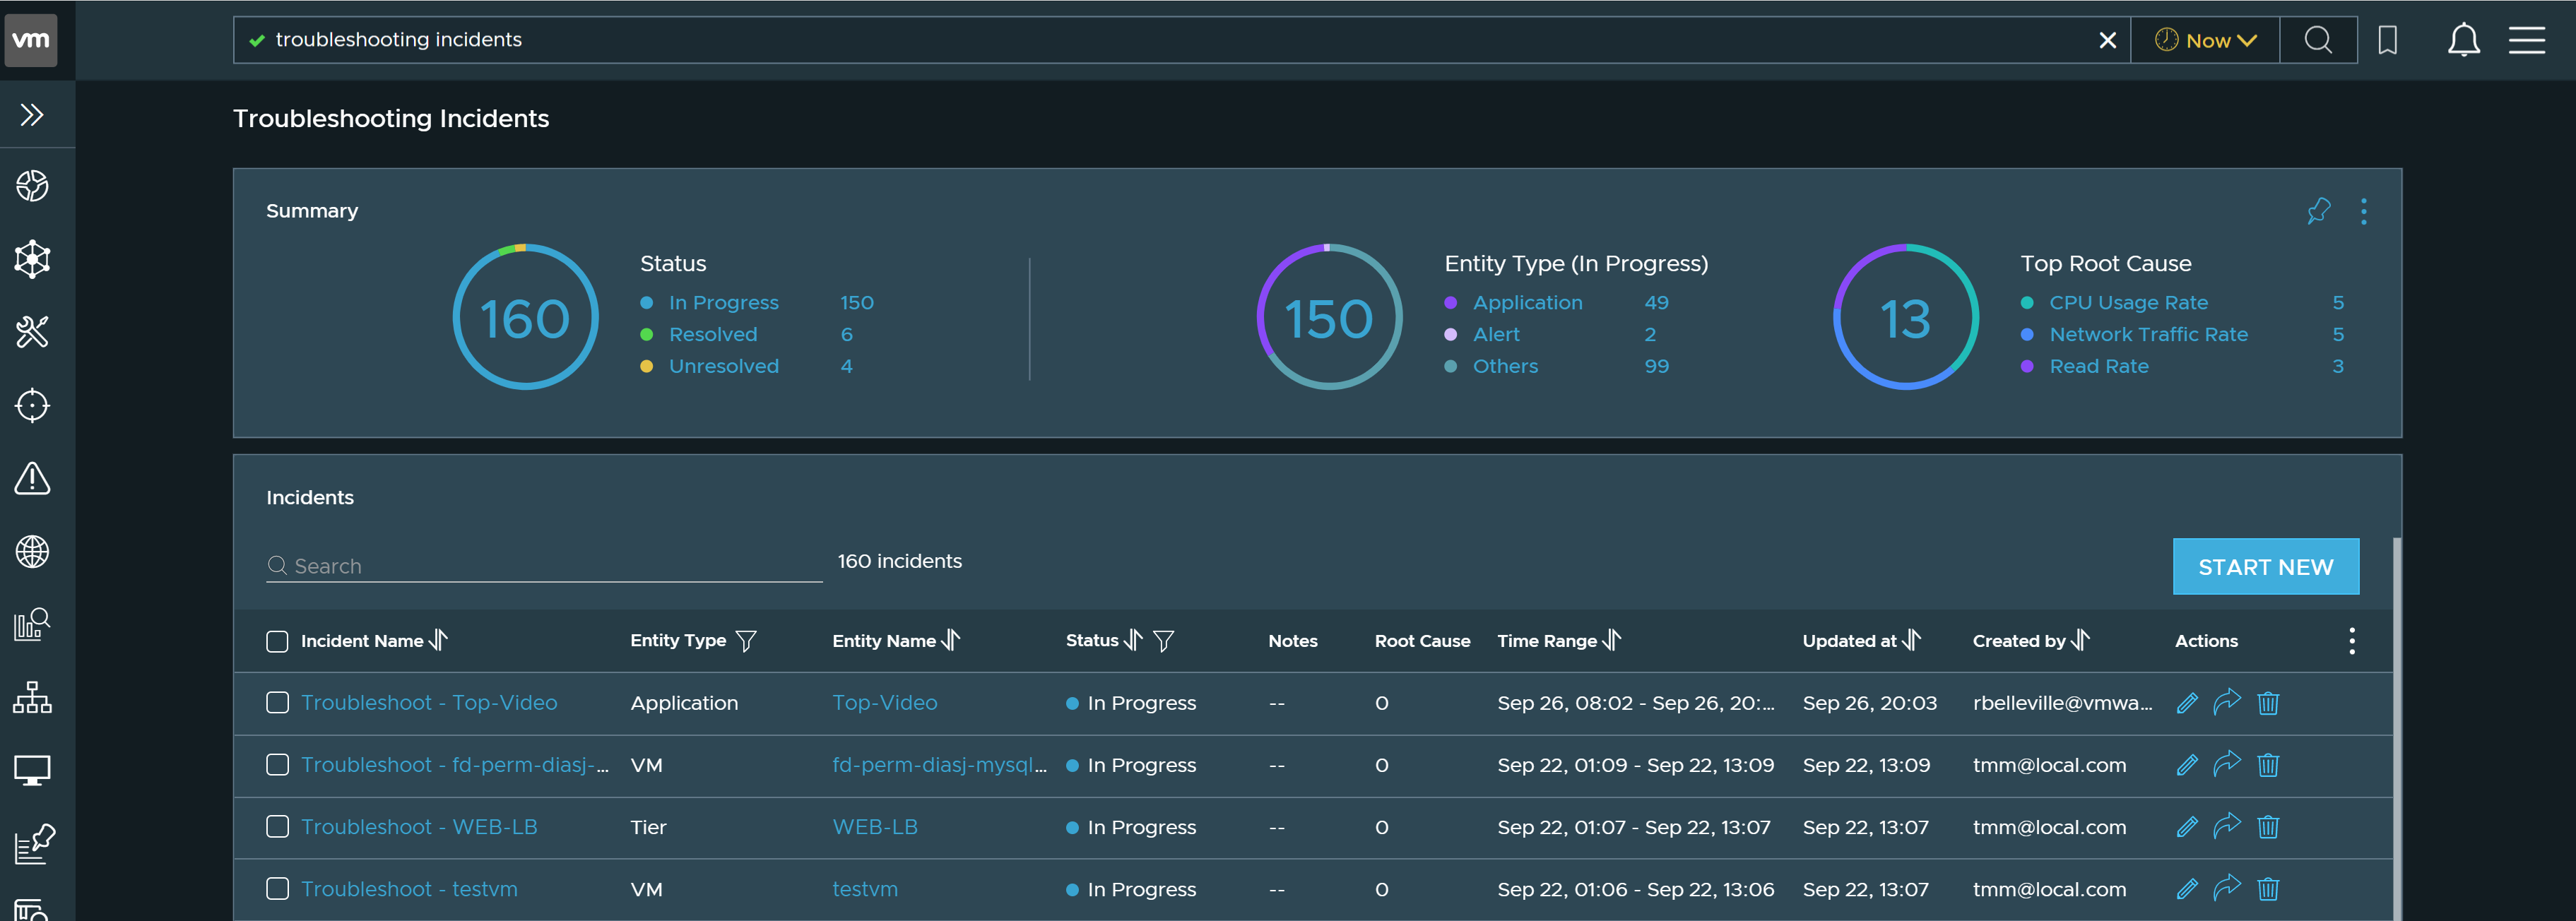
Guided Network Troubleshooting
Introduces the troubleshooting incidents feature that builds a dependency tree for applications, VMs, and threshold alerts associated with the incident. The dependency tree enables you to navigate and curate metrics, anomalies, and alerts without using any search queries. It enables you to:
-
Start troubleshooting from an application, VM, VMware NSX-T manager, or threshold alerts level and re-use existing incidents.
-
Expand and navigate the entire dependency graph to view the relationship between entities.
-
Set the sensitivity for anomaly detection.
-
View correlated metrics or single-metric anomalies.
-
Add notes for collaboration
-
Adjust the time window according to your requirement
-
Filter anomalies and flagged metrics
-
.png)
-
Introduces a Troubleshooting Incidents page that manages all the troubleshooting incidents and allows you to view open incidents based on the type and root cause of the incident. The troubleshooting incidents page enables you to:
-
Start a new incident
-
Close an incident
-
Delete and share an incident
-
View notes in an incident
-
View root-cause metrics flagged in an incident
-
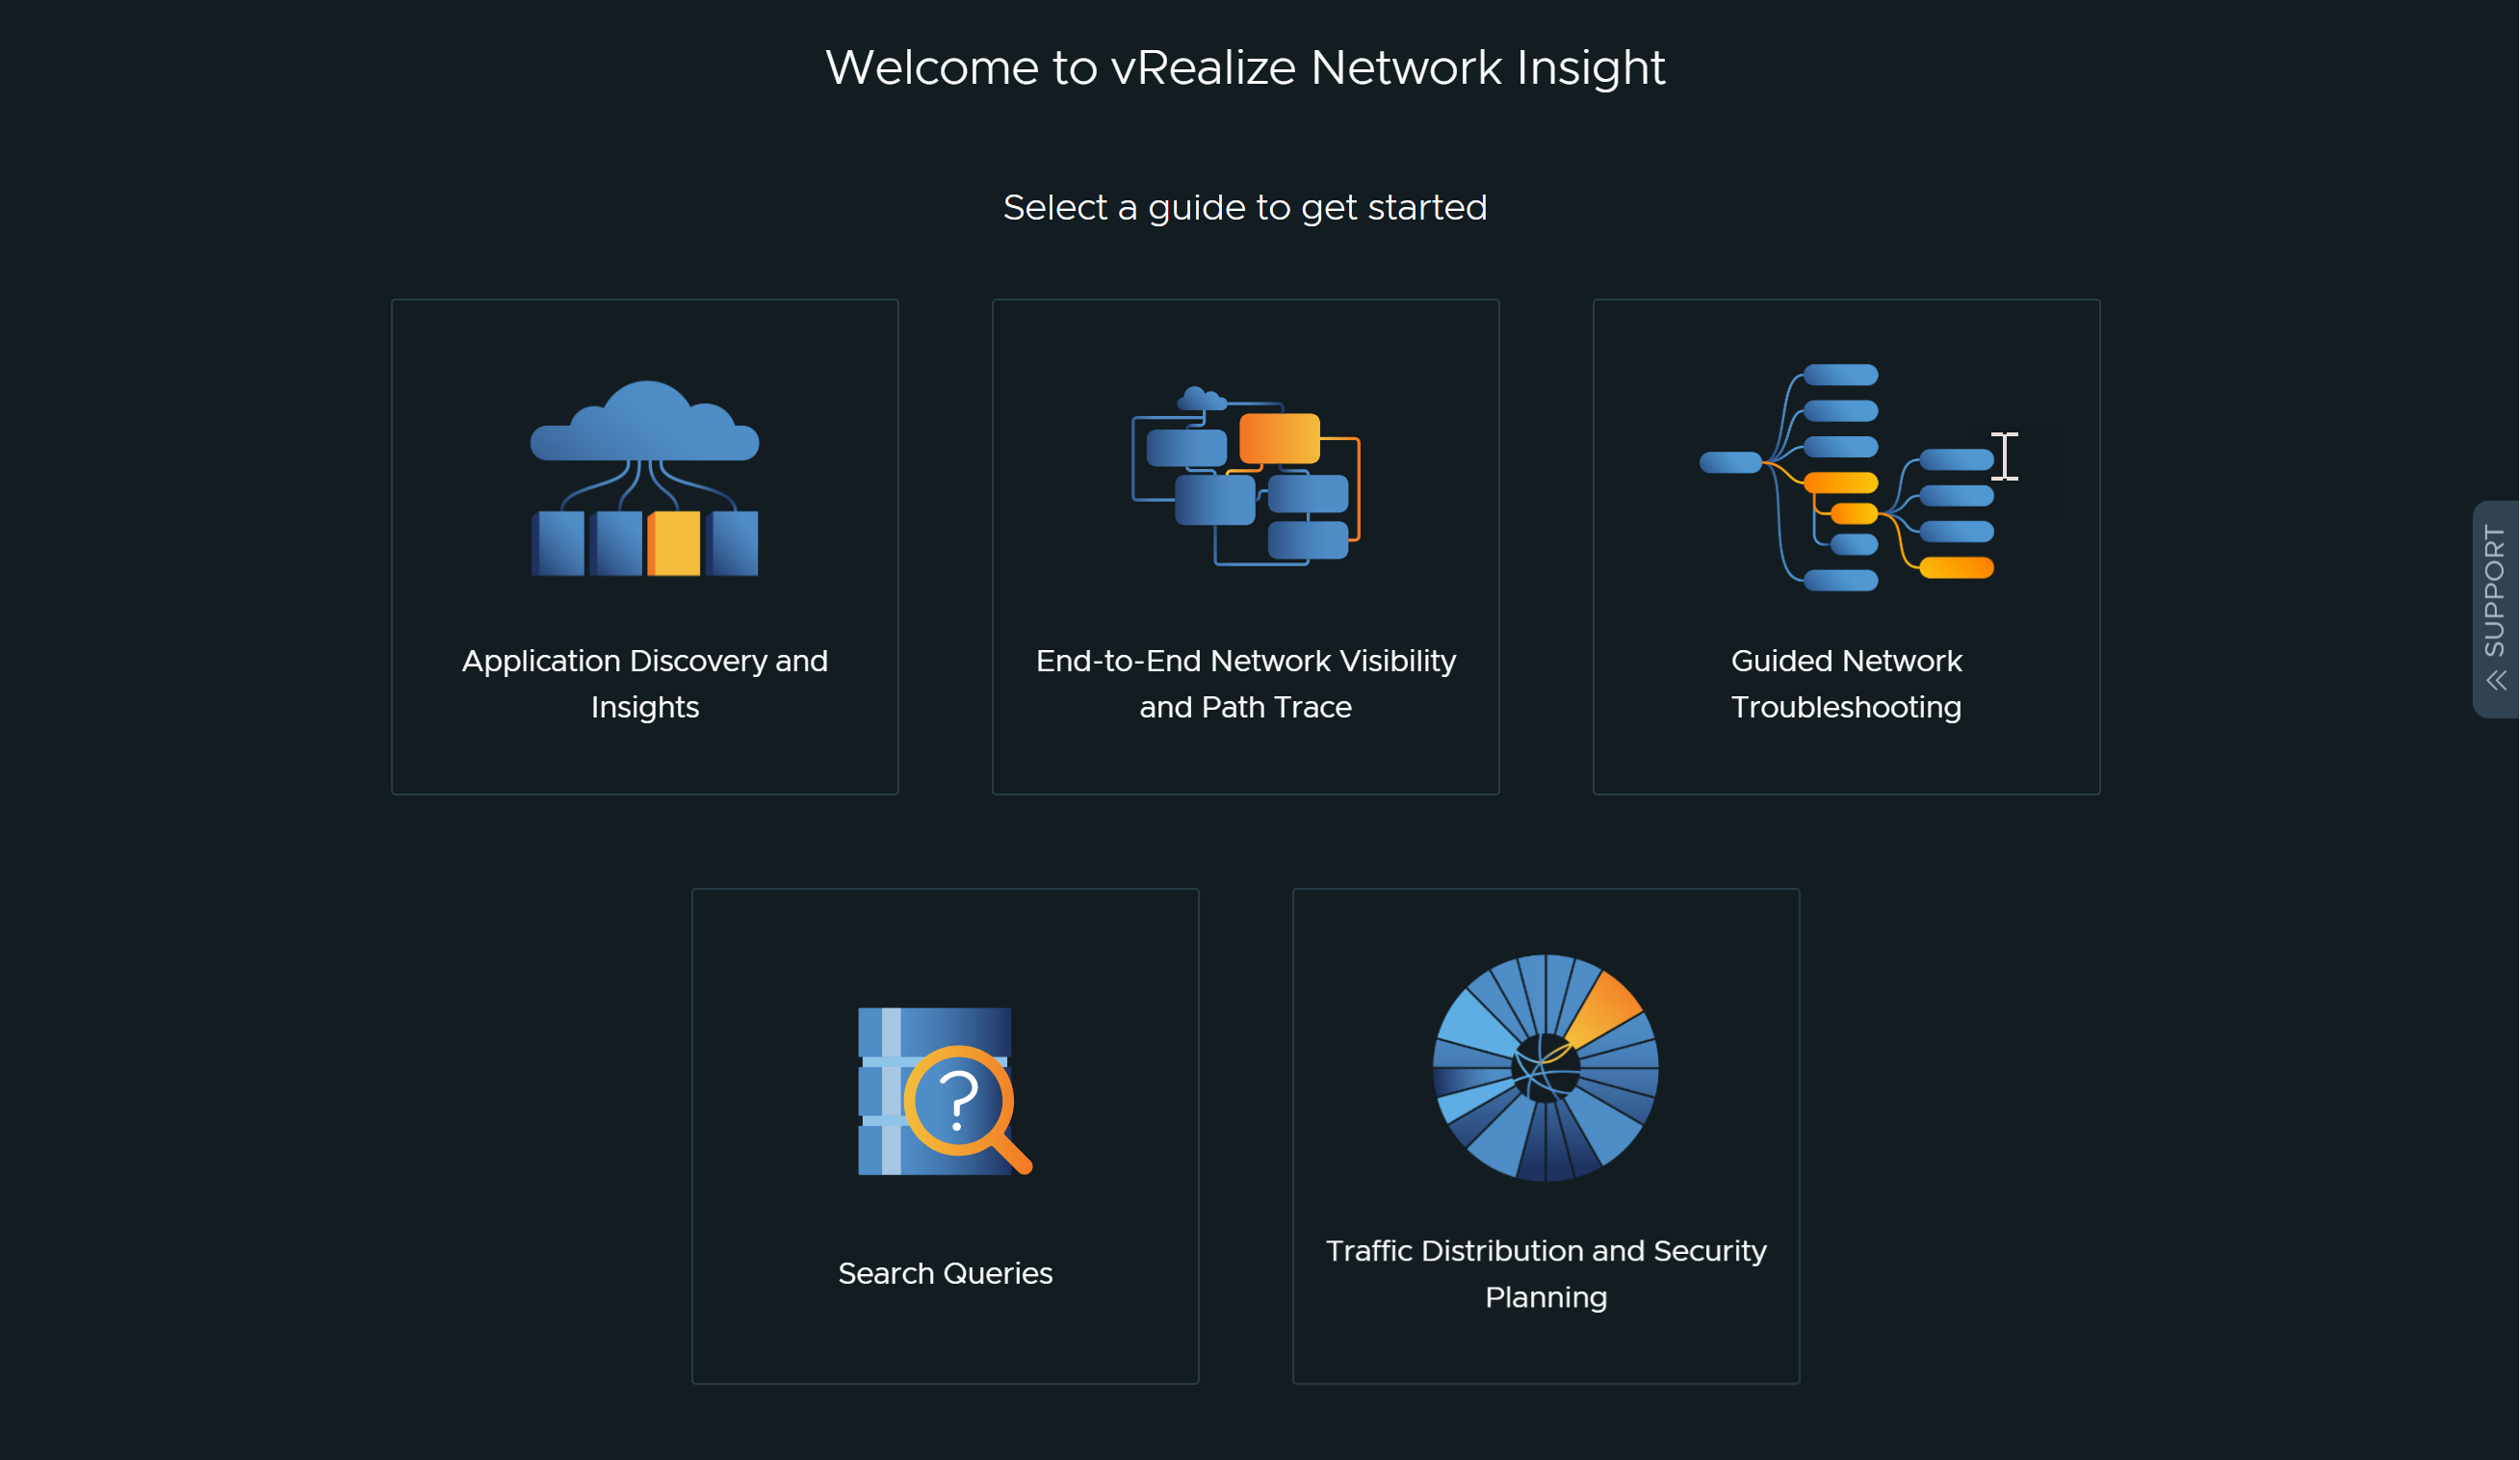
In-Product Learning
Introduces the following guided workflows:
-
Traffic Visibility and Security Planning
-
Application discovery and insights
-
End-to-end network visibility and path trace
-
Search queries
-
Guided network troubleshooting
These guides provide step-by-step instructions on how to complete a workflow from start to end. They also support guided walkthroughs for complicated pages and actions.
Others
-
Introduces support for per Core licensing. The per Core licensing supports the following license types:
-
Advanced
-
Enterprise
-
NSX Enterprise Plus
-
NSX Enterprise Plus bundle is supported from vRealize Network Insight version 6.4 and when you purchase NSX Enterprise Plus bundle, you automatically get a vRealize Network Insight Advanced License (per Core).
-
If you purchase vRealize Network Insight Enterprise (per Core) as an add-on, you need to upgrade to vRealize Network Insight 6.8. You can view the per Core license usage count on the License and Usage page.
-
-
Note: Per Core licenses cannot be mixed with Socket based licenses.
-
vRealize Suite Lifecycle Manager 8.10.0 Product Support Pack 1 supports the installation of vRealize Network Insight 6.8. See VMware vRealize Suite Lifecycle Manager 8.10.x Product Support Pack Release Notes. To install and upgrade vRealize Network Insight by using vRealize Suite Lifecycle Manager, see the vRealize Suite Lifecycle Manager Installation, Upgrade, and Management Guide.
Product Upgrade
The supported upgrade path is available at https://interopmatrix.vmware.com/#/Upgrade?productId=285.
Refer to the Upgrading vRealize Network Insight section for more information on the upgrade procedure.
Documentation
For additional information about new features, see the vRealize Network Insight documentation.
Note: As you use the vRealize Network Insight documentation, we want you to know that we value inclusion at VMware. To foster this principle within our customers, partners, and internal communities, we have updated some terminology in our documentation.
VMware Product Compatibility
The VMware Product Interoperability Matrix provides details about the compatibility of vRealize Network Insight with other VMware products.
VMware MIB Files
For MIB information, see Determining the MIB module listing, name, and type of an SNMP OID. You can download the SNMP MIB module file from the VMware Knowledge Base Article: 1013445.
Resolved Issues
-
End-to-end path search involving Cisco ACI and VMware NSX-T data sources does not work in the network map.
-
After adding an Arista device in vRealize Network Insight as a data source, vRealize Network Insight fails processing SSH command output if enabled mode is password protected. Details like Switch Ports or Port Channels might not appear on vRealize Network Insight UI.
-
You see a"Multiple NIC corresponding to Service Node IP Found" alert even if you resolve the duplicate IP address for the corresponding NICs.
-
vRealize Network Insight may display a network loop alert if VMware NSX-T tier routers have NAT configured on them.
-
Sometimes, IPFIX gets enabled for DVPGs connected to VMware NSX-T Edge VMs and gets disabled later. But this does not cause any change in the number of flows reported to vRealize Network Insight.
-
In Arista BGP EVPN Topology, network map path results are inconsistent if the gateway of the source or destination VM is a virtual IP of Arista switches configured with VARP over MLAG.
-
Unable to display discovered applications after saving them due to the presence of '(’ or ')' in the tag values. The saved applications show 0 members.
For each tag in the discovered application, escape “(” or ")" using “\” in the tier criteria while saving the application.
For example, replace
(Name) and (Tag matches 'Application:(Jira (App Prod))')with(Name) and (Tag matches 'Application:(Jira \(App Prod\))').
Known Issues
-
New - In the Network Map, if you load the Network Topology at a past time, the sub-groups of a group might be drawn at an incorrect location.
-
New - After you upgrade to version 6.8, the Network Map is not available if you try to load the Network Map in the past time.
-
New - FDB becomes unhealthy as INTERFACEID_NETOPA_ENTITY_ASSOCIATION takes up significant amount of memory and causing inaccessibility of UI.
If you delete a VNIC or PNIC when the NSX latency metric collection is enabled in vRealize Network Insight, delete the reference of INTERFACE_PNIC_PAIR_INFO or INTERFACE_PAIR_INFO from the INTERFACEID_NETOPA_ENTITY_ASSOCIATION for both the associated VNIC/PNIC.
-
New - In the Network Map, the path search for MPLS BGP VPN with VLAN interface for Cisco Catalyst does not work.
-
New - On the Home page, the Service Mesh heatmap under the HCX tab in the Environment widget shows incorrect problems count.
-
New - Application Summary shows two intents even if application intents are not enabled during application creation.
-
New - In Tag based Application Discovery, if VM tags contain special characters, such as *,{,}, \, ?, and +, then when you save the discovered applications, the saved applications show zero members.
To resolve this, you must escape these special characters using “\” in the tier criteria while saving or editing the application.
-
New - vRealize Network Insight fails to collect SNMP metrics if you select AES as a Privacy Type while enabling SNMP v3 using public API.
-
New - In Network Map, links to vSphere Distributed Switches (VDS) disappear at a high zoom level when those switches are not visible in the viewport.
-
New - In the Application Dashboard, the Security section of the Application Health Summary widget might show an incorrect count of Unprotected/Dropped Flows. Also, you might get an error when you click the Unprotected/Dropped Flows link in the Application Distribution widget.
-
New - In some instances, Flow Based Application Discovery (FABD) doesn't get enabled automatically due to brick or cluster size change.
To discover applications using FBAD, Go to Applications >Discover >Flows and click Start Discovery.
-
New - vRealize Network Insight public APIs do not return unique records for Flow, Service Endpoint, and Endpoint IP entities.
