You can use Prometheus to collect vSphere Container Storage Plug-in metrics. You can then visualize these metrics with Grafana dashboards to monitor health and stability of vSphere Container Storage Plug-in.

What Is Prometheus and Grafana?

Prometheus is an open-source monitoring software that collects, organizes, and stores metrics along with unique identifiers and timestamps. vSphere Container Storage Plug-in exposes its metrics so that Prometheus can collect them.

Using the information captured in Prometheus, you can build Grafana dashboards that help you analyse and understand the health and behavior of vSphere Container Storage Plug-in.

For more information, see the Prometheus documentation at https://prometheus.io/docs/introduction/overview/.

Exposing Prometheus Metrics

Prometheus collects metrics from targets by scraping metrics HTTP endpoints.

In the controller pod of vSphere Container Storage Plug-in, the following two containers expose metrics:

  • The vsphere-csi-controller container exposes Prometheus metrics from port 2112.

    The container provides communication from the Kubernetes Cluster API server to the CNS component on vCenter Server for volume lifecycle operations.

  • The vsphere-syncer container exposes Prometheus metrics from port 2113.

    The container sends metadata information about persistent volumes to the CNS component on vCenter Server, so that it can be displayed in the vSphere Client in the Container Volumes view.

View Prometheus Metrics

You can view Prometheus metrics exposed by vsphere-csi-controller service of vSphere Container Storage Plug-in.

  1. Get the Cluster IP of the vsphere-csi-controller service.
    # kubectl get service -n vmware-system-csi
    NAME                     TYPE        CLUSTER-IP      EXTERNAL-IP   PORT(S)             AGE
    vsphere-csi-controller   ClusterIP   10.100.XXX.XX   <none>        2112/TCP,2113/TCP   23h
  2. View Prometheus metrics exposed by the vsphere-csi-controller service.

    To get metrics exposed at a specific port, use the appropriate command.

    Action Command
    Get metrics exposed at port 2112 # curl 10.100.XXX.XX:2112/metrics
    Get metrics exposed at port 2113 # curl 10.100.XXX.XX:2113/metrics

Prometheus Metrics Exposed by vSphere Container Storage Plug-in

Name Type Description Example
vsphere_csi_info Gauge Metrics that indicates the vsphere-csi-controller container version. vsphere_csi_info{version="16b7a33"} 1
vsphere_syncer_info Gauge Metrics that indicates the vsphere-syncer container version. vsphere_syncer_info{version="16b7a33"} 1
vsphere_cns_volume_ops_histogram Vector of histogram Histogram vector metrics to observe various control operations on CNS.

The optype field indicates the type of the CNS volume operation.

The value of optype can be the following:
  • create-volume
  • delete-volume
  • attach-volume
  • detach-volume
  • update-volume-metadata
  • expand-volume
  • query-volume
  • query-all-volume
  • query-volume-info
  • relocate-volume
  • configure-volume-acl
  • query-snapshots
  • create-snapshot
  • delete-snapshot

The value of the status field can be pass or fail.

vsphere_cns_volume_ops_histogram_bucket{optype="attach-volume",status="pass",le="1"} 1

vsphere_cns_volume_ops_histogram_sum{optype="attach-volume",status="pass"} 6.611152518

vsphere_cns_volume_ops_histogram_count{optype="attach-volume",status="pass"} 3

vsphere_csi_volume_ops_histogram Vector of histogram Histogram vector metrics to observe various control operations in vSphere Container Storage Plug-in.

The optype field indicates the type of the volume operation performed by vSphere Container Storage Plug-in.

The value of optype can be the following:
  • create-volume
  • delete-volume
  • attach-volume
  • detach-volume
  • expand-volume
  • create-snapshot
  • delete-snapshot
  • list-snapshot

The value of the status field can be pass or fail.

vsphere_csi_volume_ops_histogram_bucket{optype="create-volume",status="pass",voltype="block",le="7"} 3

vsphere_csi_volume_ops_histogram_sum{optype="create- volume",status="pass",voltype="block"} 9.983518201

vsphere_csi_volume_ops_histogram_count{optype="create-volume",status="pass",voltype="block"} 3

vsphere_full_sync_ops_histogram Vector of histogram Histogram vector metric to observe the full synchronization operation of vSphere Container Storage Plug-in.

The value of the status field can be pass or fail.

vsphere_full_sync_ops_histogram_bucket{status="pass",le="7"} 73

vsphere_full_sync_ops_histogram_sum{status="pass"} 7.559699346999998

vsphere_full_sync_ops_histogram_count{status="pass"} 73

Deploy Prometheus and Build Grafana Dashboards

Follow this sample workflow to deploy a Prometheus and build Grafana dashboards.

Deploy Prometheus Monitoring Stack

Deploy a Prometheus monitoring stack that includes AlertManager and Grafana.

Procedure

  1. Clone the kube-prometheus repository from GitHub.
    % git clone https://github.com/prometheus-operator/kube-prometheus
    Cloning into 'kube-prometheus'...
    remote: Enumerating objects: 15523, done.
    remote: Counting objects: 100% (209/209), done.
    remote: Compressing objects: 100% (119/119), done.
    remote: Total 15523 (delta 126), reused 123 (delta 78), pack-reused 15314
    Receiving objects: 100% (15523/15523), 7.79 MiB | 542.00 KiB/s, done.
    Resolving deltas: 100% (9884/9884), done.
    
    % cd kube-prometheus
    
    % ls
    CHANGELOG.md experimental
    CONTRIBUTING.md go.mod
    DCO go.sum
    LICENSE jsonnet
    Makefile jsonnetfile.json
    README.md jsonnetfile.lock.json
    RELEASE.md kubescape-exceptions.json
    build.sh kustomization.yaml
    code-of-conduct.md manifests
    developer-workspace scripts
    docs sync-to-internal-registry.jsonnet
    example.jsonnet tests
    examples
    %
  2. Apply the kube-prometheus manifests.
    1. Create the CRDs used by the Prometheus stack.
      % kubectl apply --server-side -f manifests/setup
      customresourcedefinition.apiextensions.k8s.io/alertmanagerconfigs.monitoring.coreos.com serverside-applied
      customresourcedefinition.apiextensions.k8s.io/alertmanagers.monitoring.coreos.com serverside-applied
      customresourcedefinition.apiextensions.k8s.io/podmonitors.monitoring.coreos.com serverside-applied
      customresourcedefinition.apiextensions.k8s.io/probes.monitoring.coreos.com serverside-applied
      customresourcedefinition.apiextensions.k8s.io/prometheuses.monitoring.coreos.com serverside-applied
      customresourcedefinition.apiextensions.k8s.io/prometheusrules.monitoring.coreos.com serverside-applied
      customresourcedefinition.apiextensions.k8s.io/servicemonitors.monitoring.coreos.com serverside-applied
      customresourcedefinition.apiextensions.k8s.io/thanosrulers.monitoring.coreos.com serverside-applied
      namespace/monitoring serverside-applied
      
      
      % kubectl get crd
      NAME                                             CREATED AT
      alertmanagerconfigs.monitoring.coreos.com        2022-03-09T09:16:24Z
      alertmanagers.monitoring.coreos.com              2022-03-09T09:16:25Z
      backups.velero.io                                2022-02-18T11:12:17Z
      backupstoragelocations.velero.io                 2022-02-18T11:12:17Z
      cnsvolumeoperationrequests.cns.vmware.com        2022-02-10T11:38:35Z
      csinodetopologies.cns.vmware.com                 2022-02-10T11:38:55Z
      deletebackuprequests.velero.io                   2022-02-18T11:12:17Z
      downloadrequests.velero.io                       2022-02-18T11:12:17Z
      podmonitors.monitoring.coreos.com                2022-03-09T09:16:25Z
      podvolumebackups.velero.io                       2022-02-18T11:12:17Z
      podvolumerestores.velero.io                      2022-02-18T11:12:17Z
      probes.monitoring.coreos.com                     2022-03-09T09:16:25Z
      prometheuses.monitoring.coreos.com               2022-03-09T09:16:26Z
      prometheusrules.monitoring.coreos.com            2022-03-09T09:16:27Z
      resticrepositories.velero.io                     2022-02-18T11:12:17Z
      restores.velero.io                               2022-02-18T11:12:17Z
      schedules.velero.io                              2022-02-18T11:12:18Z
      serverstatusrequests.velero.io                   2022-02-18T11:12:18Z
      servicemonitors.monitoring.coreos.com            2022-03-09T09:16:27Z
      thanosrulers.monitoring.coreos.com               2022-03-09T09:16:27Z
      volumesnapshotclasses.snapshot.storage.k8s.io    2022-02-10T11:48:15Z
      volumesnapshotcontents.snapshot.storage.k8s.io   2022-02-10T11:48:16Z
      volumesnapshotlocations.velero.io                2022-02-18T11:12:18Z
      volumesnapshots.snapshot.storage.k8s.io          2022-02-10T11:48:17Z
    2. Deploy and verify the Prometheus stack objects.
      % kubectl apply -f manifests/
      alertmanager.monitoring.coreos.com/main created
      poddisruptionbudget.policy/alertmanager-main created
      prometheusrule.monitoring.coreos.com/alertmanager-main-rules created
      secret/alertmanager-main created
      service/alertmanager-main created
      serviceaccount/alertmanager-main created
      servicemonitor.monitoring.coreos.com/alertmanager-main created
      clusterrole.rbac.authorization.k8s.io/blackbox-exporter created
      clusterrolebinding.rbac.authorization.k8s.io/blackbox-exporter created
      configmap/blackbox-exporter-configuration created
      deployment.apps/blackbox-exporter created
      service/blackbox-exporter created
      serviceaccount/blackbox-exporter created
      servicemonitor.monitoring.coreos.com/blackbox-exporter created
      secret/grafana-config created
      secret/grafana-datasources created
      configmap/grafana-dashboard-alertmanager-overview created
      configmap/grafana-dashboard-apiserver created
      configmap/grafana-dashboard-cluster-total created
      configmap/grafana-dashboard-controller-manager created
      configmap/grafana-dashboard-grafana-overview created
      configmap/grafana-dashboard-k8s-resources-cluster created
      configmap/grafana-dashboard-k8s-resources-namespace created
      configmap/grafana-dashboard-k8s-resources-node created
      configmap/grafana-dashboard-k8s-resources-pod created
      configmap/grafana-dashboard-k8s-resources-workload created
      configmap/grafana-dashboard-k8s-resources-workloads-namespace created
      configmap/grafana-dashboard-kubelet created
      configmap/grafana-dashboard-namespace-by-pod created
      configmap/grafana-dashboard-namespace-by-workload created
      configmap/grafana-dashboard-node-cluster-rsrc-use created
      configmap/grafana-dashboard-node-rsrc-use created
      configmap/grafana-dashboard-nodes created
      configmap/grafana-dashboard-persistentvolumesusage created
      configmap/grafana-dashboard-pod-total created
      configmap/grafana-dashboard-prometheus-remote-write created
      configmap/grafana-dashboard-prometheus created
      configmap/grafana-dashboard-proxy created
      configmap/grafana-dashboard-scheduler created
      configmap/grafana-dashboard-workload-total created
      configmap/grafana-dashboards created
      deployment.apps/grafana created
      prometheusrule.monitoring.coreos.com/grafana-rules created
      service/grafana created
      serviceaccount/grafana created
      servicemonitor.monitoring.coreos.com/grafana created
      prometheusrule.monitoring.coreos.com/kube-prometheus-rules created
      clusterrole.rbac.authorization.k8s.io/kube-state-metrics created
      clusterrolebinding.rbac.authorization.k8s.io/kube-state-metrics created
      deployment.apps/kube-state-metrics created
      prometheusrule.monitoring.coreos.com/kube-state-metrics-rules created
      service/kube-state-metrics created
      serviceaccount/kube-state-metrics created
      servicemonitor.monitoring.coreos.com/kube-state-metrics created
      prometheusrule.monitoring.coreos.com/kubernetes-monitoring-rules created
      servicemonitor.monitoring.coreos.com/kube-apiserver created
      servicemonitor.monitoring.coreos.com/coredns created
      servicemonitor.monitoring.coreos.com/kube-controller-manager created
      servicemonitor.monitoring.coreos.com/kube-scheduler created
      servicemonitor.monitoring.coreos.com/kubelet created
      clusterrole.rbac.authorization.k8s.io/node-exporter created
      clusterrolebinding.rbac.authorization.k8s.io/node-exporter created
      daemonset.apps/node-exporter created
      prometheusrule.monitoring.coreos.com/node-exporter-rules created
      service/node-exporter created
      serviceaccount/node-exporter created
      servicemonitor.monitoring.coreos.com/node-exporter created
      clusterrole.rbac.authorization.k8s.io/prometheus-k8s created
      clusterrolebinding.rbac.authorization.k8s.io/prometheus-k8s created
      poddisruptionbudget.policy/prometheus-k8s created
      prometheus.monitoring.coreos.com/k8s created
      prometheusrule.monitoring.coreos.com/prometheus-k8s-prometheus-rules created
      rolebinding.rbac.authorization.k8s.io/prometheus-k8s-config created
      rolebinding.rbac.authorization.k8s.io/prometheus-k8s created
      rolebinding.rbac.authorization.k8s.io/prometheus-k8s created
      rolebinding.rbac.authorization.k8s.io/prometheus-k8s created
      role.rbac.authorization.k8s.io/prometheus-k8s-config created
      role.rbac.authorization.k8s.io/prometheus-k8s created
      role.rbac.authorization.k8s.io/prometheus-k8s created
      role.rbac.authorization.k8s.io/prometheus-k8s created
      service/prometheus-k8s created
      serviceaccount/prometheus-k8s created
      servicemonitor.monitoring.coreos.com/prometheus-k8s created
      apiservice.apiregistration.k8s.io/v1beta1.metrics.k8s.io created
      clusterrole.rbac.authorization.k8s.io/prometheus-adapter created
      clusterrole.rbac.authorization.k8s.io/system:aggregated-metrics-reader created
      clusterrolebinding.rbac.authorization.k8s.io/prometheus-adapter created
      clusterrolebinding.rbac.authorization.k8s.io/resource-metrics:system:auth-delegator created
      clusterrole.rbac.authorization.k8s.io/resource-metrics-server-resources created
      configmap/adapter-config created
      deployment.apps/prometheus-adapter created
      poddisruptionbudget.policy/prometheus-adapter created
      rolebinding.rbac.authorization.k8s.io/resource-metrics-auth-reader created
      service/prometheus-adapter created
      serviceaccount/prometheus-adapter created
      servicemonitor.monitoring.coreos.com/prometheus-adapter created
      clusterrole.rbac.authorization.k8s.io/prometheus-operator created
      clusterrolebinding.rbac.authorization.k8s.io/prometheus-operator created
      deployment.apps/prometheus-operator created
      prometheusrule.monitoring.coreos.com/prometheus-operator-rules created
      service/prometheus-operator created
      serviceaccount/prometheus-operator created
      servicemonitor.monitoring.coreos.com/prometheus-operator created
      
      
      % kubectl get servicemonitors -A
      NAMESPACE    NAME                      AGE
      monitoring   alertmanager-main         46s
      monitoring   blackbox-exporter         45s
      monitoring   coredns                   25s
      monitoring   grafana                   27s
      monitoring   kube-apiserver            25s
      monitoring   kube-controller-manager   24s
      monitoring   kube-scheduler            24s
      monitoring   kube-state-metrics        26s
      monitoring   kubelet                   24s
      monitoring   node-exporter             23s
      monitoring   prometheus-adapter        17s
      monitoring   prometheus-k8s            20s
      monitoring   prometheus-operator       16s
      
      
      % kubectl get pod -n monitoring
      NAME                                  READY   STATUS    RESTARTS   AGE
      alertmanager-main-0                    2/2    Running   0          95s
      alertmanager-main-1                    2/2    Running   0          95s
      alertmanager-main-2                    2/2    Running   0          95s
      blackbox-exporter-7d89b9b799-svr4t     3/3    Running   0          2m5s
      grafana-5577bc8799-b5bnd               1/1    Running   0          107s
      kube-state-metrics-d5754d6dc-spx4w     3/3    Running   0          106s
      node-exporter-8b44z                    2/2    Running   0          103s
      node-exporter-jrxrc                    2/2    Running   0          103s
      node-exporter-pj7nb                    2/2    Running   0          103s
      prometheus-adapter-6998fcc6b5-dlqk6    1/1    Running   0          97s
      prometheus-adapter-6998fcc6b5-qswk4    1/1    Running   0          97s
      prometheus-k8s-0                       2/2    Running   0          94s
      prometheus-k8s-1                       2/2    Running   0          94s
      prometheus-operator-59647c66cf-ldppj   2/2    Running   0          96s
      
      
      % kubectl get svc -n monitoring
      NAME                    TYPE        CLUSTER-IP      EXTERNAL-IP   PORT(S)                      AGE
      alertmanager-main       ClusterIP   10.96.161.166   <none>        9093/TCP,8080/TCP            7m18s
      alertmanager-operated   ClusterIP   None            <none>        9093/TCP,9094/TCP,9094/UDP   6m47s
      blackbox-exporter       ClusterIP   10.104.28.233   <none>        9115/TCP,19115/TCP           7m17s
      grafana                 ClusterIP   10.97.77.202    <none>        3000/TCP                     7m
      kube-state-metrics      ClusterIP   None            <none>        8443/TCP,9443/TCP            6m58s
      node-exporter           ClusterIP   None            <none>        9100/TCP                     6m55s
      prometheus-adapter      ClusterIP   10.104.10.57    <none>        443/TCP                      6m50s
      prometheus-k8s          ClusterIP   10.99.185.136   <none>        9090/TCP,8080/TCP            6m53s
      prometheus-operated     ClusterIP   None            <none>        9090/TCP                     6m46s
      prometheus-operator     ClusterIP   None            <none>        8443/TCP         
  3. Adjust the ClusterRole prometheus-k8s.
    When deployed through kube-prometheus, the ClusterRole prometheus-k8s does not have the necessary apiGroup resources and verbs rules to pick up metrics of vSphere Container Storage Plug-in. You must modify the ClusterRole with the necessary rules.
    1. Display the ClusterRole after it was first created.
      % kubectl get ClusterRole prometheus-k8s -o yaml
      apiVersion: rbac.authorization.k8s.io/v1
      kind: ClusterRole
      metadata:
        annotations:
          kubectl.kubernetes.io/last-applied-configuration: |
            {"apiVersion":"rbac.authorization.k8s.io/v1","kind":"ClusterRole","metadata":{"annotations":{},"labels":{"app.kubernetes.io/component":"prometheus","app.kubernetes.io/instance":"k8s","app.kubernetes.io/name":"prometheus","app.kubernetes.io/part-of":"kube-prometheus","app.kubernetes.io/version":"2.33.4"},"name":"prometheus-k8s"},"rules":[{"apiGroups":[""],"resources":["nodes/metrics"],"verbs":["get"]},{"nonResourceURLs":["/metrics"],"verbs":["get"]}]}
        creationTimestamp: "2022-03-09T09:19:39Z"
        labels:
          app.kubernetes.io/component: prometheus
          app.kubernetes.io/instance: k8s
          app.kubernetes.io/name: prometheus
          app.kubernetes.io/part-of: kube-prometheus
          app.kubernetes.io/version: 2.33.4
        name: prometheus-k8s
        resourceVersion: "7283142"
        uid: e18f021c-3e6e-4162-98ca-bbf912b75b06
      rules:
      - apiGroups:
        - ""
        resources:
        - nodes/metrics
        verbs:
        - get
      - nonResourceURLs:
        - /metrics
        verbs:
        - get
    2. Update the apiGroup resources and verbs rules of the manifest.
      % cat prometheus-clusterRole-updated.yaml
      apiVersion: rbac.authorization.k8s.io/v1
      kind: ClusterRole
      metadata:
        labels:
          app.kubernetes.io/component: prometheus
          app.kubernetes.io/instance: k8s
          app.kubernetes.io/name: prometheus
          app.kubernetes.io/part-of: kube-prometheus
          app.kubernetes.io/version: 2.33.0
        name: prometheus-k8s
      rules:
      - apiGroups:
        - ""
        resources:
        - nodes
        - services
        - endpoints
        - pods
        verbs: ["get", "list", "watch"]
      - nonResourceURLs:
        - /metrics
        verbs:
        - get
      % kubectl apply -f prometheus-clusterRole-updated.yaml
      clusterrole.rbac.authorization.k8s.io/prometheus-k8s configured
    3. Display the updated ClusterRole.
      % kubectl get ClusterRole prometheus-k8s -o yaml
      apiVersion: rbac.authorization.k8s.io/v1
      kind: ClusterRole
      metadata:
        annotations:
          kubectl.kubernetes.io/last-applied-configuration: |
            {"apiVersion":"rbac.authorization.k8s.io/v1","kind":"ClusterRole","metadata":{"annotations":{},"labels":{"app.kubernetes.io/component":"prometheus","app.kubernetes.io/instance":"k8s","app.kubernetes.io/name":"prometheus","app.kubernetes.io/part-of":"kube-prometheus","app.kubernetes.io/version":"2.33.0"},"name":"prometheus-k8s"},"rules":[{"apiGroups":[""],"resources":["nodes","services","endpoints","pods"],"verbs":["get","list","watch"]},{"nonResourceURLs":["/metrics"],"verbs":["get"]}]}
        creationTimestamp: "2022-03-09T09:19:39Z"
        labels:
          app.kubernetes.io/component: prometheus
          app.kubernetes.io/instance: k8s
          app.kubernetes.io/name: prometheus
          app.kubernetes.io/part-of: kube-prometheus
          app.kubernetes.io/version: 2.33.0
        name: prometheus-k8s
        resourceVersion: "7284231"
        uid: e18f021c-3e6e-4162-98ca-bbf912b75b06
      rules:
      - apiGroups:
        - ""
        resources:
        - nodes
        - services
        - endpoints
        - pods
        verbs:
        - get
        - list
        - watch
      - nonResourceURLs:
        - /metrics
        verbs:
        - get
  4. Create Service Monitor.
    You must create a ServiceMonitor object to monitor any service, such as vSphere Container Storage Plug-in, through Prometheus.
    1. Create the manifest and deploy the ServiceMonitor object.
      The object will be used to monitor the vsphere-csi-controller service. The endpoints refer to ports 2112 (ctlr) and 2113 (syncer).
      % cat vsphere-csi-controller-service-monitor.yaml
      apiVersion: monitoring.coreos.com/v1
      kind: ServiceMonitor
      metadata:
        name: vsphere-csi-controller-prometheus-servicemonitor
        namespace: monitoring
        labels:
          name: vsphere-csi-controller-prometheus-servicemonitor
      spec:
        selector:
          matchLabels:
            app: vsphere-csi-controller
        namespaceSelector:
          matchNames:
          - vmware-system-csi
        endpoints:
        - port: ctlr
        - port: syncer
      
      
      % kubectl apply -f vsphere-csi-controller-service-monitor.yaml
      servicemonitor.monitoring.coreos.com/vsphere-csi-controller-prometheus-servicemonitor created
    2. Verify that ServiceMonitors are running.
      % kubectl get servicemonitors -A
      NAMESPACE    NAME                                              AGE
      monitoring  alertmanager-main                                  9m32s
      monitoring  blackbox-exporter                                  9m31s
      monitoring  coredns                                            9m11s
      monitoring  grafana                                            9m13s
      monitoring  kube-apiserver                                     9m11s
      monitoring  kube-controller-manager                            9m10s
      monitoring  kube-scheduler                                     9m10s
      monitoring  kube-state-metrics                                 9m12s
      monitoring  kubelet                                            9m10s
      monitoring  node-exporter                                      9m9s
      monitoring  prometheus-adapter                                 9m3s
      monitoring  prometheus-k8s                                     9m6s
      monitoring  prometheus-operator                                9m2s
      monitoring  vsphere-csi-controller-prometheus-servicemonitor   42s
    3. Check the logs on the prometheus-k8s-* nodes in the monitoring namespace.
      The logs list any potential issues with scraping metrics from vSphere Container Storage Plug-in. For example, if you have not correctly updated the ClusterRole, you can observe errors similar to this:
      ts=2022-03-07T15:15:06.580Z caller=klog.go:116 level=error component=k8s_client_runtime    
      func=ErrorDepth msg="pkg/mod/k8s.io/[email protected]/tools/cache/reflector.go:167:       
      Failed to watch *v1.Endpoints: failed to list *v1.Endpoints: endpoints is forbidden: 
      User \"system:serviceaccount:monitoring:prometheus-k8s\" cannot list resource \"endpoints\"
      in API group \"\" in the namespace \"vmware-system-csi\""

Launch Prometheus UI

Access Prometheus UI and view the vSphere Container Storage Plug-in metrics that Prometheus collects.

Procedure

  1. Make Prometheus server UI accessible.
    By default, a Prometheus service prometheus-k8s that you deployed in Step b is of ClusterIP type. This means that it is an internal service and not accessible externally.
    % kubectl get svc prometheus-k8s -n monitoring
    NAME            TYPE        CLUSTER-IP      EXTERNAL-IP  PORT(S)            AGE
    prometheus-k8s  ClusterIP  10.99.185.136  <none>        9090/TCP,8080/TCP  97m
    You can use various methods to address this, such as change the service type to NodePort or LoadBalancer if you have one available to provide LoadBalancer IPs.
    For the purposes of this testing, port-forward the service and port (9090), and make it accessible from local host.
    % kubectl --namespace monitoring port-forward svc/prometheus-k8s 9090
    Forwarding from 127.0.0.1:9090 -> 9090
    Forwarding from [::1]:9090 -> 9090
  2. Open a browser on your desktop and connect to http://localhost:9090 to see the Prometheus UI.
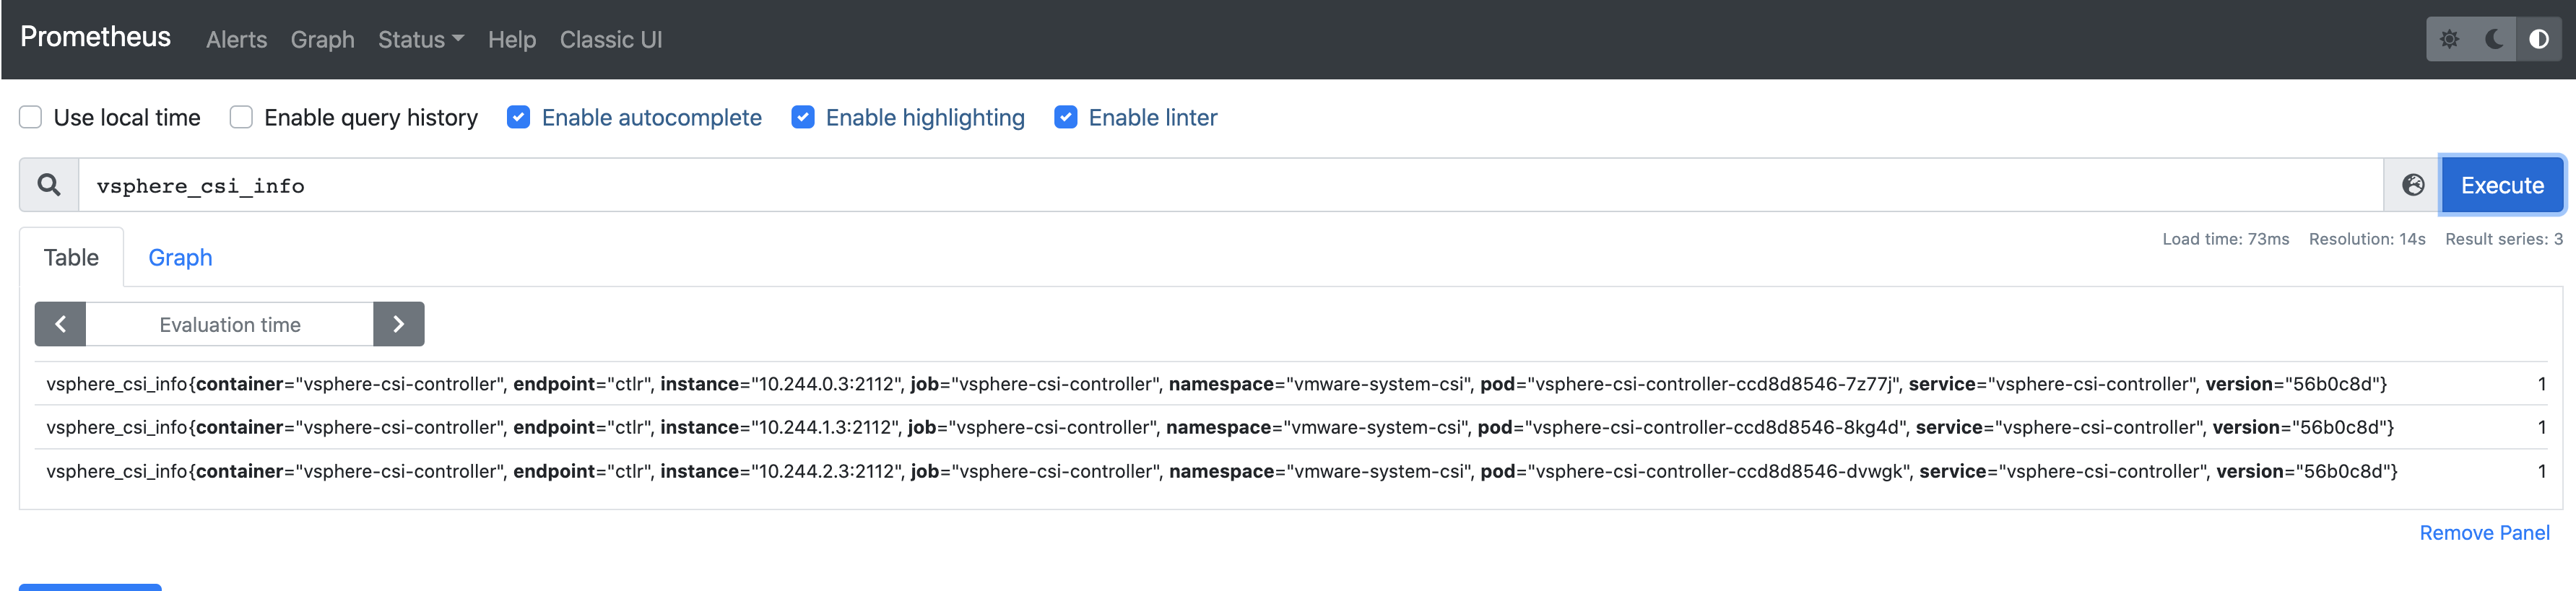
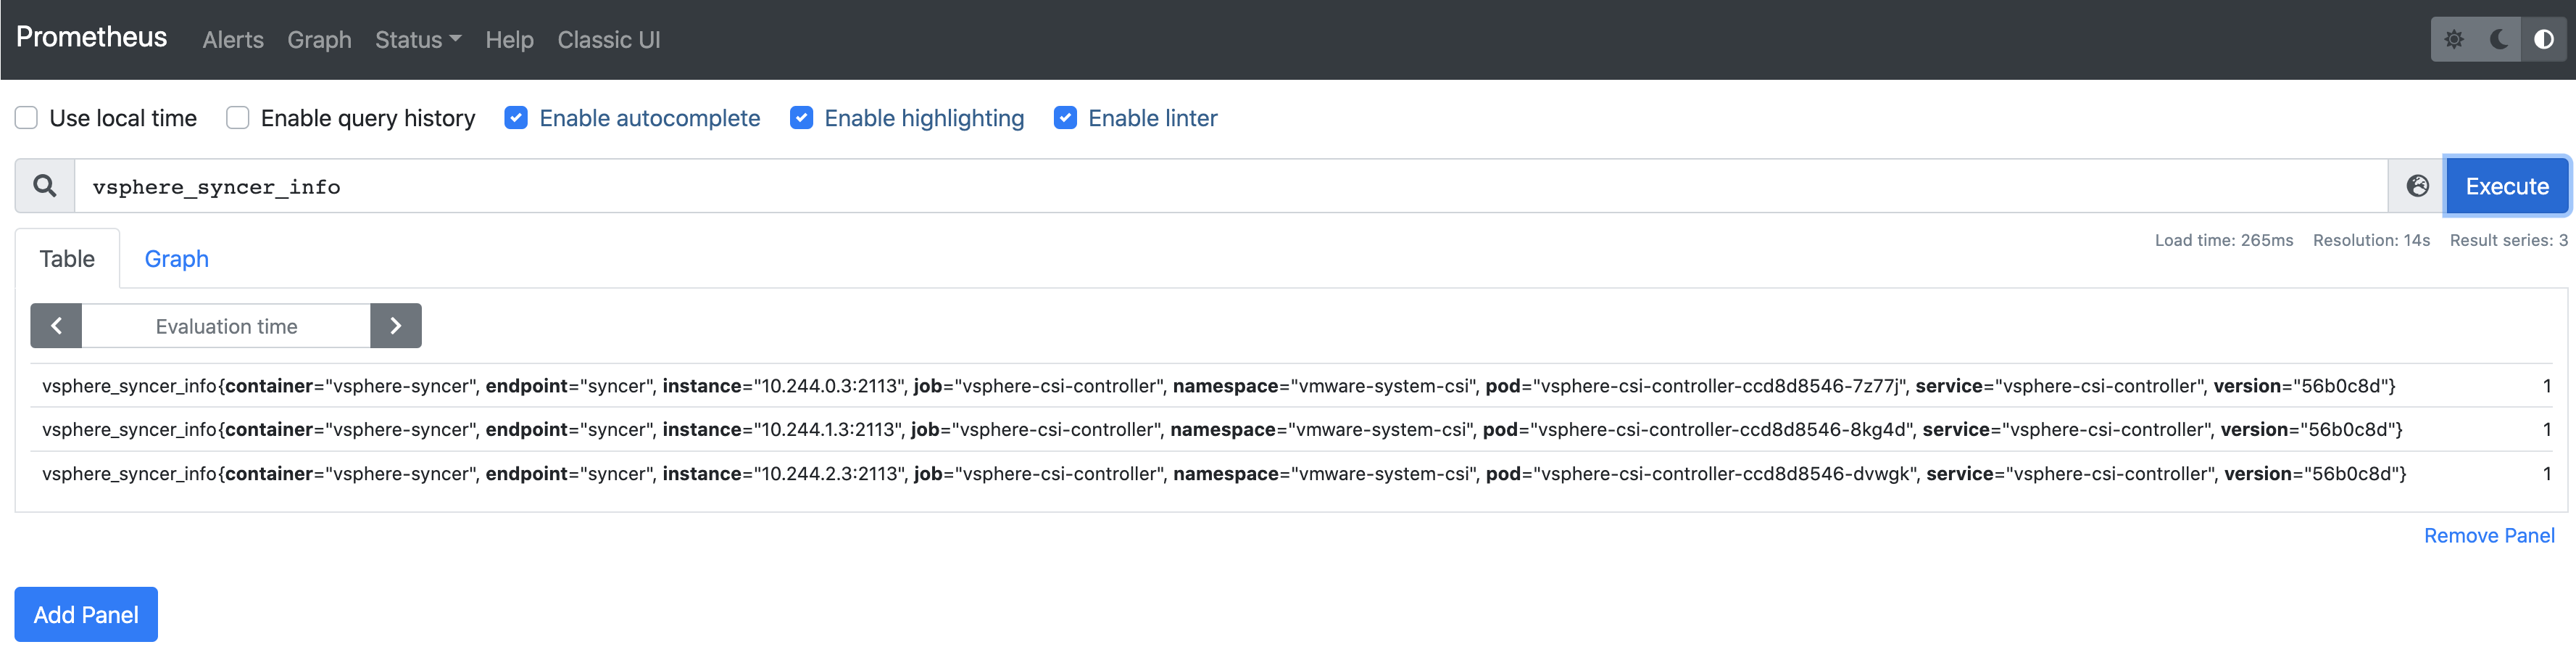
  3. View the following metrics.
    • vsphere-csi-info exposed by vsphere-csi-controller container from port 2112.

      The Promethus server UI displays various metrics from port 2112 when you search for vsphere-csi-info.

    • vsphere-syncer-info exposed by vsphere-syncer container from port 2113.

      The Promethus server UI displays various metrics from port 2113 when you search for vsphere-syncer-info.

Create Grafana Dashboard

Launch the Grafana portal and create a dashboard to display metrics of vSphere Container Storage Plug-in.

Procedure

  1. Make Grafana UI accessible.
    As with Prometheus, Grafana is deployed as ClusterIP and is not accessible externally.

    Use the port-forward functionality to access Grafana from a browser on the local host. This time the port is 3000.

    % kubectl get svc grafana -n monitoring
    NAME      TYPE        CLUSTER-IP    EXTERNAL-IP   PORT(S)    AGE
    grafana   ClusterIP   10.97.77.202  <none>        3000/TCP  98m
    
    
    % kubectl --namespace monitoring port-forward svc/grafana 3000
    Forwarding from 127.0.0.1:3000 -> 3000
    Forwarding from [::1]:3000 -> 3000
  2. Access the Grafana UI through http://localhost:3000.
  3. In Grafana UI, set up the dashboard for vSphere Container Storage Plug-in.
    You can import sample dashboards from a GitHub location at https://github.com/kubernetes-sigs/vsphere-csi-driver/tree/master/grafana-dashboard.
    For information on how to import a Grafana dashboard, see Grafana documentation at Export and import.
  4. Review the Grafana dashboard.
    The dashboard similar to the following displays the vSphere Container Storage Plug-in metrics that have been scraped and stored by Prometheus.

    The diagram displays the vSphere Container Storage Plug-in metrics that have been scraped and stored by Prometheus.

Set Up a Prometheus Alert

You can define an alert for vsphere-csi-controller to notify you when something is wrong.

Procedure

  1. Verify that an alert manager has been deployed.
    The alert manager is normally deployed in addition to other services when you deploy kube-prometheus.
    % kubectl get service -n monitoring
    NAME                    TYPE        CLUSTER-IP      EXTERNAL-IP   PORT(S)                         AGE
    alertmanager-main       ClusterIP   10.102.4.82     <none>        9093/TCP,8080/TCP               19h
    alertmanager-operated   ClusterIP   None            <none>        9093/TCP,9094/TCP,9094/UDP      19h
    blackbox-exporter       ClusterIP   10.98.242.67    <none>        9115/TCP,19115/TCP              19h
    grafana                 NodePort    10.102.89.156   <none>        3000:31926/TCP                  19h
    kube-state-metrics      ClusterIP   None            <none>        8443/TCP,9443/TCP               19h
    node-exporter           ClusterIP   None            <none>        9100/TCP                        19h
    prometheus-adapter      ClusterIP   10.98.39.123    <none>        443/TCP                         19h
    prometheus-k8s          NodePort    10.105.37.241   <none>        9090:30091/TCP,8080:32536/TCP   19h
    prometheus-operated     ClusterIP   None            <none>        9090/TCP                        19h
    prometheus-operator     ClusterIP   None            <none>        8443/TCP                        19h
    
    % kubectl get pod -n monitoring
    NAME                                   READY   STATUS    RESTARTS   AGE
    alertmanager-main-0                    2/2     Running   0          19h
    alertmanager-main-1                    2/2     Running   0          19h
    alertmanager-main-2                    2/2     Running   0          19h
    blackbox-exporter-55bb7b586b-dpfxb     3/3     Running   0          19h
    grafana-7474bdd9cb-5mklg               1/1     Running   0          19h
    kube-state-metrics-c655879df-vg8qc     3/3     Running   0          19h
    node-exporter-2bk6j                    2/2     Running   0          19h
    node-exporter-fmzhq                    2/2     Running   0          19h
    node-exporter-n446g                    2/2     Running   0          19h
    node-exporter-q4qk2                    2/2     Running   0          19h
    node-exporter-zjkrf                    2/2     Running   0          19h
    node-exporter-ztvmm                    2/2     Running   0          19h
    prometheus-adapter-6b59dfc556-ks2c9    1/1     Running   0          19h
    prometheus-adapter-6b59dfc556-m9rpb    1/1     Running   0          19h
    prometheus-k8s-0                       2/2     Running   0          19h
    prometheus-k8s-1                       2/2     Running   0          19h
    prometheus-operator-7b997546f8-pzs8t   2/2     Running   0          19h
  2. Define an alert for vsphere-csi-controller.
    To do this, you need to specify PrometheusRule for vsphere-csi-controller.
    The following example shows an alert when the CreateVolume success rate is lower than 95%.
    % /kube-prometheus/manifests# cat vsphereCSIController-prometheusRule.yaml
    apiVersion: monitoring.coreos.com/v1
    kind: PrometheusRule
    metadata:
      labels:
        app.kubernetes.io/component: vsphere-csi-controller
        app.kubernetes.io/name: vsphere-csi-controller
        app.kubernetes.io/part-of: kube-prometheus
        prometheus: k8s
        role: alert-rules
      name: vsphere-csi-controller-rules
      namespace: monitoring
    spec:
      groups:
      - name: vsphere.csi.controller.rules
        rules:
        - alert: CreateVolumeSuccessRateLow
          annotations:
            description: Success rate of CSI volume OP "create-volume" is lower than 95% in last 6 hours.
            summary: Success rate of CSI volume OP "create-volume" is lower than 95% in last 6 hours.   
          expr: sum(rate(vsphere_csi_volume_ops_histogram_count{status="pass", optype="create-volume"}[6h]))/sum (rate(vsphere_csi_volume_ops_histogram_count{optype="create-volume"}[6h]))*100 < 95 
          for: 5m
          labels:
            issue: Success rate of CSI volume OP "create-volume" is lower than 95% in last 6 hours.
            severity: warning