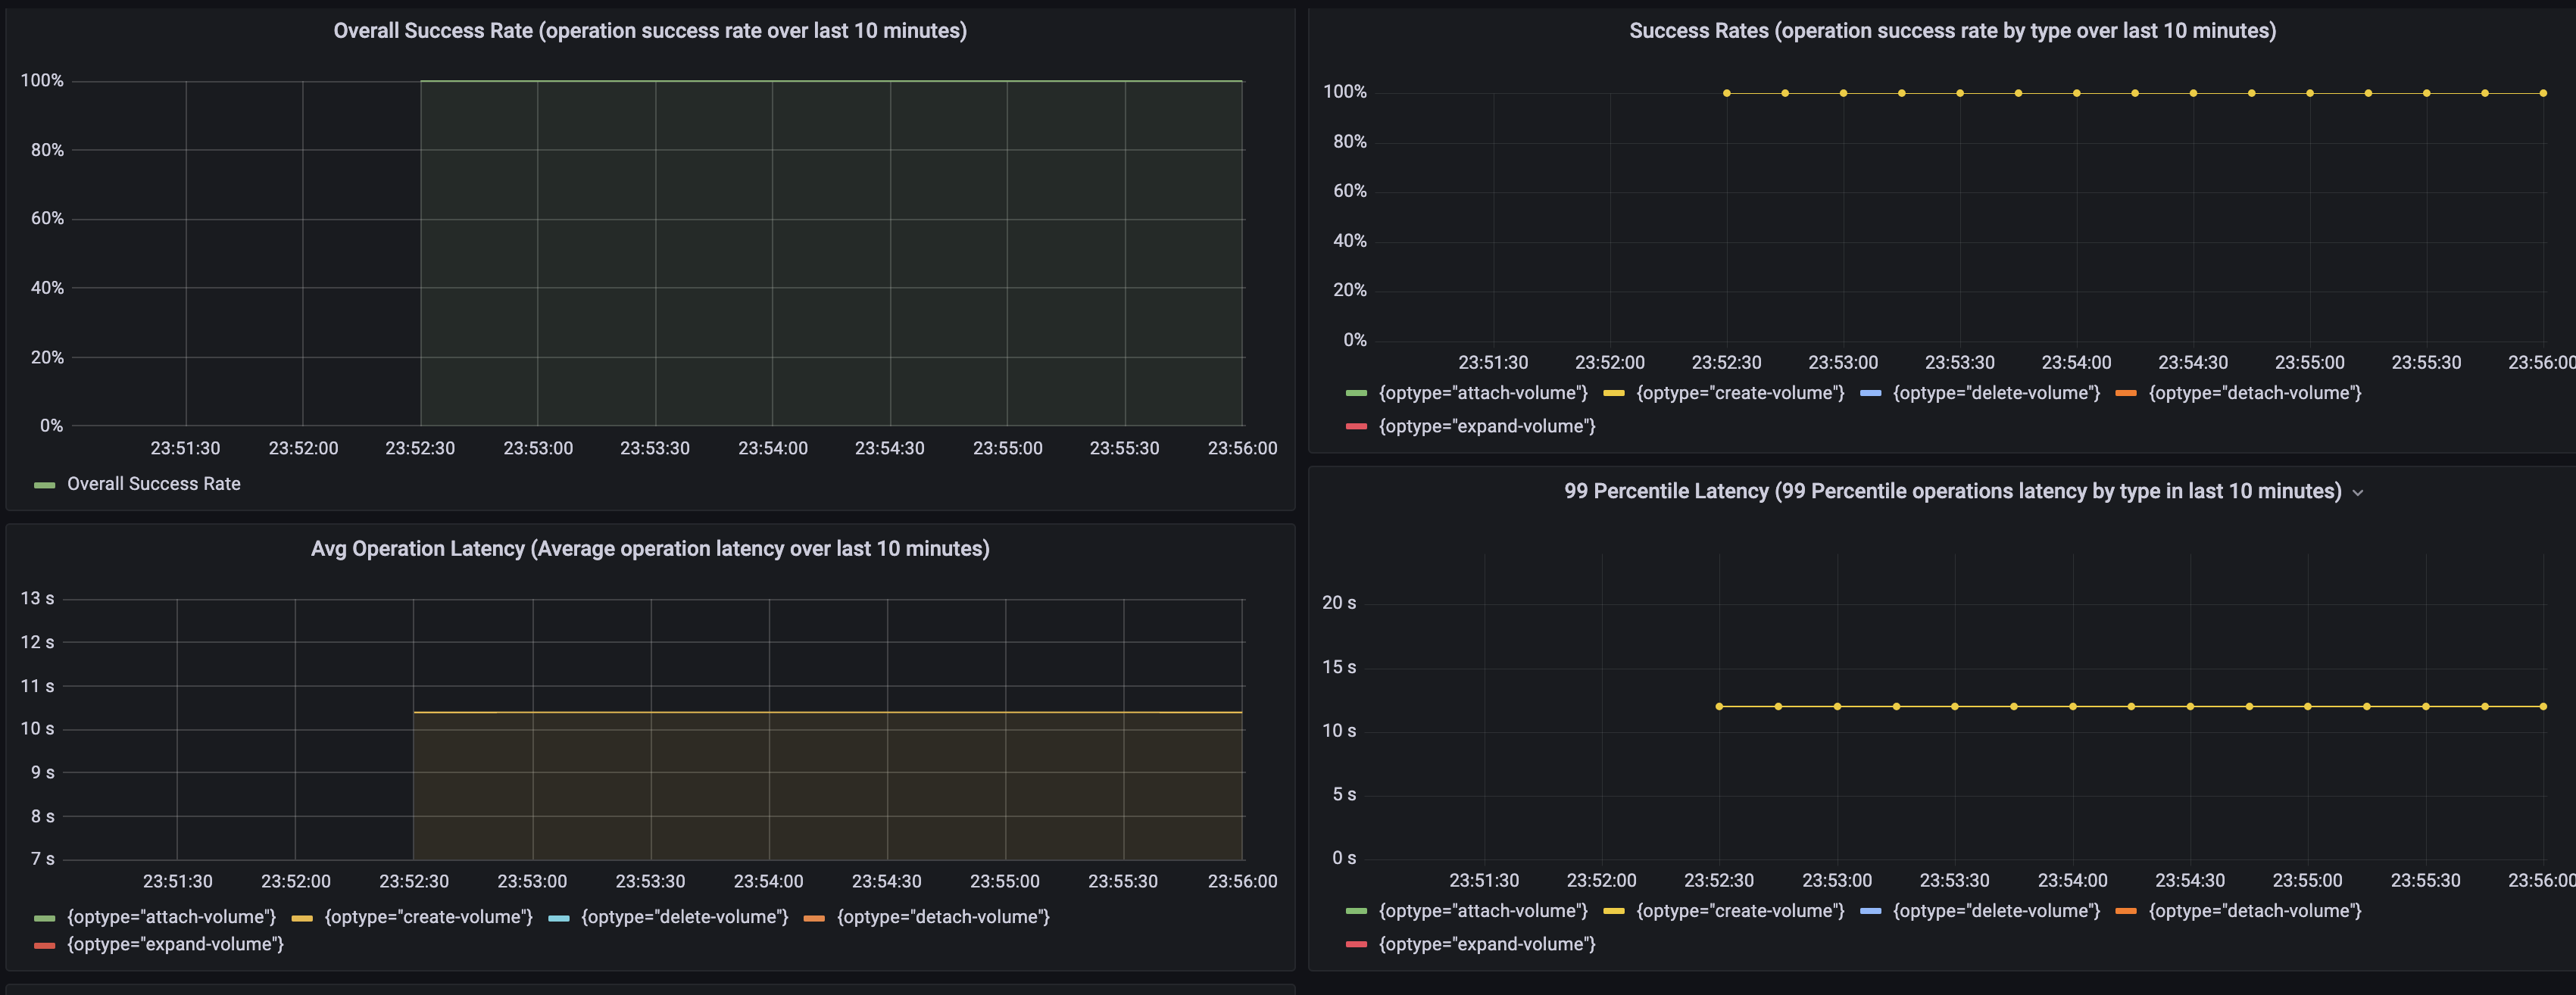
You can use Prometheus to collect vSphere Container Storage Plug-in metrics. You can then visualize these metrics with Grafana dashboards to monitor health and stability of vSphere Container Storage Plug-in.
What Is Prometheus and Grafana?
Prometheus is an open-source monitoring software that collects, organizes, and stores metrics along with unique identifiers and timestamps. vSphere Container Storage Plug-in exposes its metrics so that Prometheus can collect them.
Using the information captured in Prometheus, you can build Grafana dashboards that help you analyse and understand the health and behavior of vSphere Container Storage Plug-in.
For more information, see the Prometheus documentation at https://prometheus.io/docs/introduction/overview/.
Exposing Prometheus Metrics
Prometheus collects metrics from targets by scraping metrics HTTP endpoints.
In the controller pod of vSphere Container Storage Plug-in, the following two containers expose metrics:
- The
vsphere-csi-controllercontainer exposes Prometheus metrics from port 2112.The container provides communication from the Kubernetes Cluster API server to the CNS component on vCenter Server for volume lifecycle operations.
- The
vsphere-syncercontainer exposes Prometheus metrics from port 2113.The container sends metadata information about persistent volumes to the CNS component on vCenter Server, so that it can be displayed in the vSphere Client in the Container Volumes view.
View Prometheus Metrics
You can view Prometheus metrics exposed by vsphere-csi-controller service of vSphere Container Storage Plug-in.
- Get the Cluster IP of the
vsphere-csi-controllerservice.# kubectl get service -n vmware-system-csi NAME TYPE CLUSTER-IP EXTERNAL-IP PORT(S) AGE vsphere-csi-controller ClusterIP 10.100.XXX.XX <none> 2112/TCP,2113/TCP 23h
- View Prometheus metrics exposed by the
vsphere-csi-controllerservice.To get metrics exposed at a specific port, use the appropriate command.
Action Command Get metrics exposed at port 2112 # curl 10.100.XXX.XX:2112/metrics Get metrics exposed at port 2113 # curl 10.100.XXX.XX:2113/metrics
Prometheus Metrics Exposed by vSphere Container Storage Plug-in
| Name | Type | Description | Example |
|---|---|---|---|
| vsphere_csi_info | Gauge | Metrics that indicates the vsphere-csi-controller container version. |
vsphere_csi_info{version="16b7a33"} 1 |
| vsphere_syncer_info | Gauge | Metrics that indicates the vsphere-syncer container version. |
vsphere_syncer_info{version="16b7a33"} 1 |
| vsphere_cns_volume_ops_histogram | Vector of histogram | Histogram vector metrics to observe various control operations on CNS. The
The value of
optype can be the following:
The value of the |
|
| vsphere_csi_volume_ops_histogram | Vector of histogram | Histogram vector metrics to observe various control operations in vSphere Container Storage Plug-in. The
The value of
optype can be the following:
The value of the |
|
| vsphere_full_sync_ops_histogram | Vector of histogram | Histogram vector metric to observe the full synchronization operation of vSphere Container Storage Plug-in. The value of the |
|
Deploy Prometheus and Build Grafana Dashboards
Follow this sample workflow to deploy a Prometheus and build Grafana dashboards.
Deploy Prometheus Monitoring Stack
Deploy a Prometheus monitoring stack that includes AlertManager and Grafana.
Procedure
Launch Prometheus UI
Access Prometheus UI and view the vSphere Container Storage Plug-in metrics that Prometheus collects.
Procedure
Create Grafana Dashboard
Launch the Grafana portal and create a dashboard to display metrics of vSphere Container Storage Plug-in.
Procedure
Set Up a Prometheus Alert
You can define an alert for vsphere-csi-controller to notify you when something is wrong.


