


As a cloud administrator, you need to know when vRealize Automation capacity, performance, and availability are becoming problematic so that you can proactively react before users begin to run out of resources.
You can display a range of alerts provided by the associated vRealize Operations Manager application. Alerts are available for vSphere and VMware Cloud on AWS resource objects. Use information in alerts to modify the resources and deployments that you manage, or share that information with your team so they can modify objects that they manage.
To examine and act on project deployments that you should consider optimizing, see How to use Alerts to optimize deployments in vRealize Automation.
Alerts are currently available for vSphere and VMware Cloud on AWS resource objects only. The Alerts tab is only available if access to vRealize Operations Manager is configured.
The vRealize Automation alerts threshold values are set in vRealize Operations Manager. Some vRealize Automation alerts are currently predefined. Alerts notifications are also set in vRealize Operations Manager. For information about setting alert definitions and configuring notifications, see vRealize Operations Manager product documentation.
Prerequisites
- Review Resource management and deployment optimization using vRealize Operations Manager metrics in vRealize Automation.
- Verify that you have vRealize Automation cloud administrator credentials and have enabled HTTPS access on port 443. See Credentials required for working with cloud accounts in vRealize Automation.
- Verify that you have the vRealize Automation cloud administrator user role. See What are the vRealize Automation user roles.
- Configure vRealize Automation integration with vRealize Operations Manager.
- Configure the vRealize Automation adapter in vRealize Operations Manager.
- Configure the roles that are need to manage alerts. See Custom user roles in vRealize Automation.
Role capabilities include:
- Cloud administrators can manage cloud zone alerts.
- Project administrators can manage project alerts.
- Service broker administrators can manage deployment alerts.
About vRealize Operations Manager and resource alerts
vRealize Operations Manager collects health, usage, and other metrics for the same infrastructure resources and deployments that you manage in vRealize Automation. By integrating vRealize Automation with vRealize Operations Manager, that monitored data is made available to you in vRealize Automation by using the Alerts tab in the Cloud Assembly main menu .
The alerts data provided by vRealize Operations Manager includes heath and risk threshold concerns for cloud templates, deployments, organizations, and projects. It also contains information about deployments that can be optimized, based on the owner being contacted by an action taken on the cloud zone Insights tab. See How to use the Insights dashboard to monitor resource capacity and notify project owners in vRealize Automation.
- Project name
- Deployment name (and link to the deployment) that contain resources that can be optimized
- Suggested actions
- Potential cost savings from reclamation and optimization
- Total number of virtual CPUs used by the deployment
- Total amount of RAM memory used by the deployment
- Total amount of storage used by the deployment
- Virtual machines in the deployment that are recommended for reclamation and optimization, including resource name, idle machines, powered off machines, oversized and undersized machines, underutilized machines, and machine snapshots
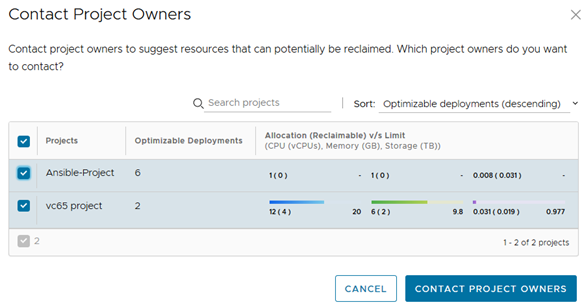
By using the Contact project owners option on the cloud zone Insights dashboard, you can see a summary of all projects that have reclaimable capacity (CPU, memory, and storage) in the cloud zone and provide an alert to some or all of the project owners.
Procedure
You can display alerts threshold information about the resources that you manage by using filtering options on the Alerts page. Alerts data is supplied by your associated vRealize Operations Manager application. Suggested actions are provided for each alert.
You can also select a deployment from the Deployments to review section to open and optimize that deployment. See How to use Alerts to optimize deployments in vRealize Automation.
- From within the Cloud Assembly service, click the Alerts tab in the main menu.

- To control the how alerts are displayed, experiment with the available filters. For example, select the Resources option from the filters drop-down menu.
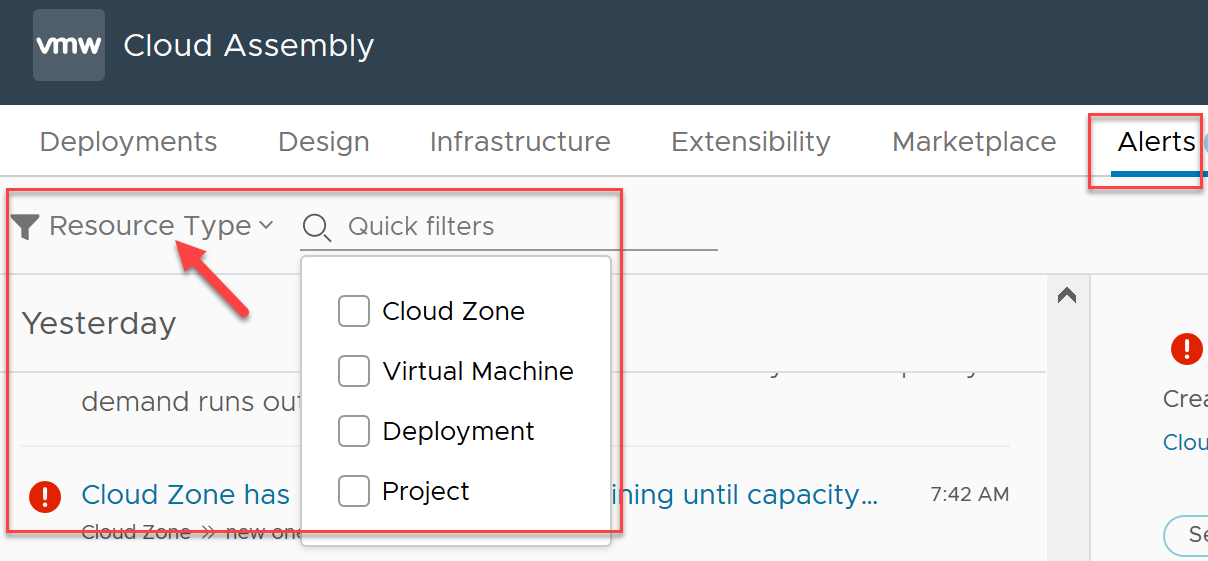
- To display alerts and suggested actions for those alerts, use quick filter options in the selector panel.
- Display alerts about cloud zone resources.

vRealize Operations Manager can monitor time remaining, capacity remaining, reclaimable capacity, and so on.
- Display alerts about virtual machine resources.

The majority of virtual machine alerts pertain to on/off status, latency, and so on.
- Display alerts about deployment resources.
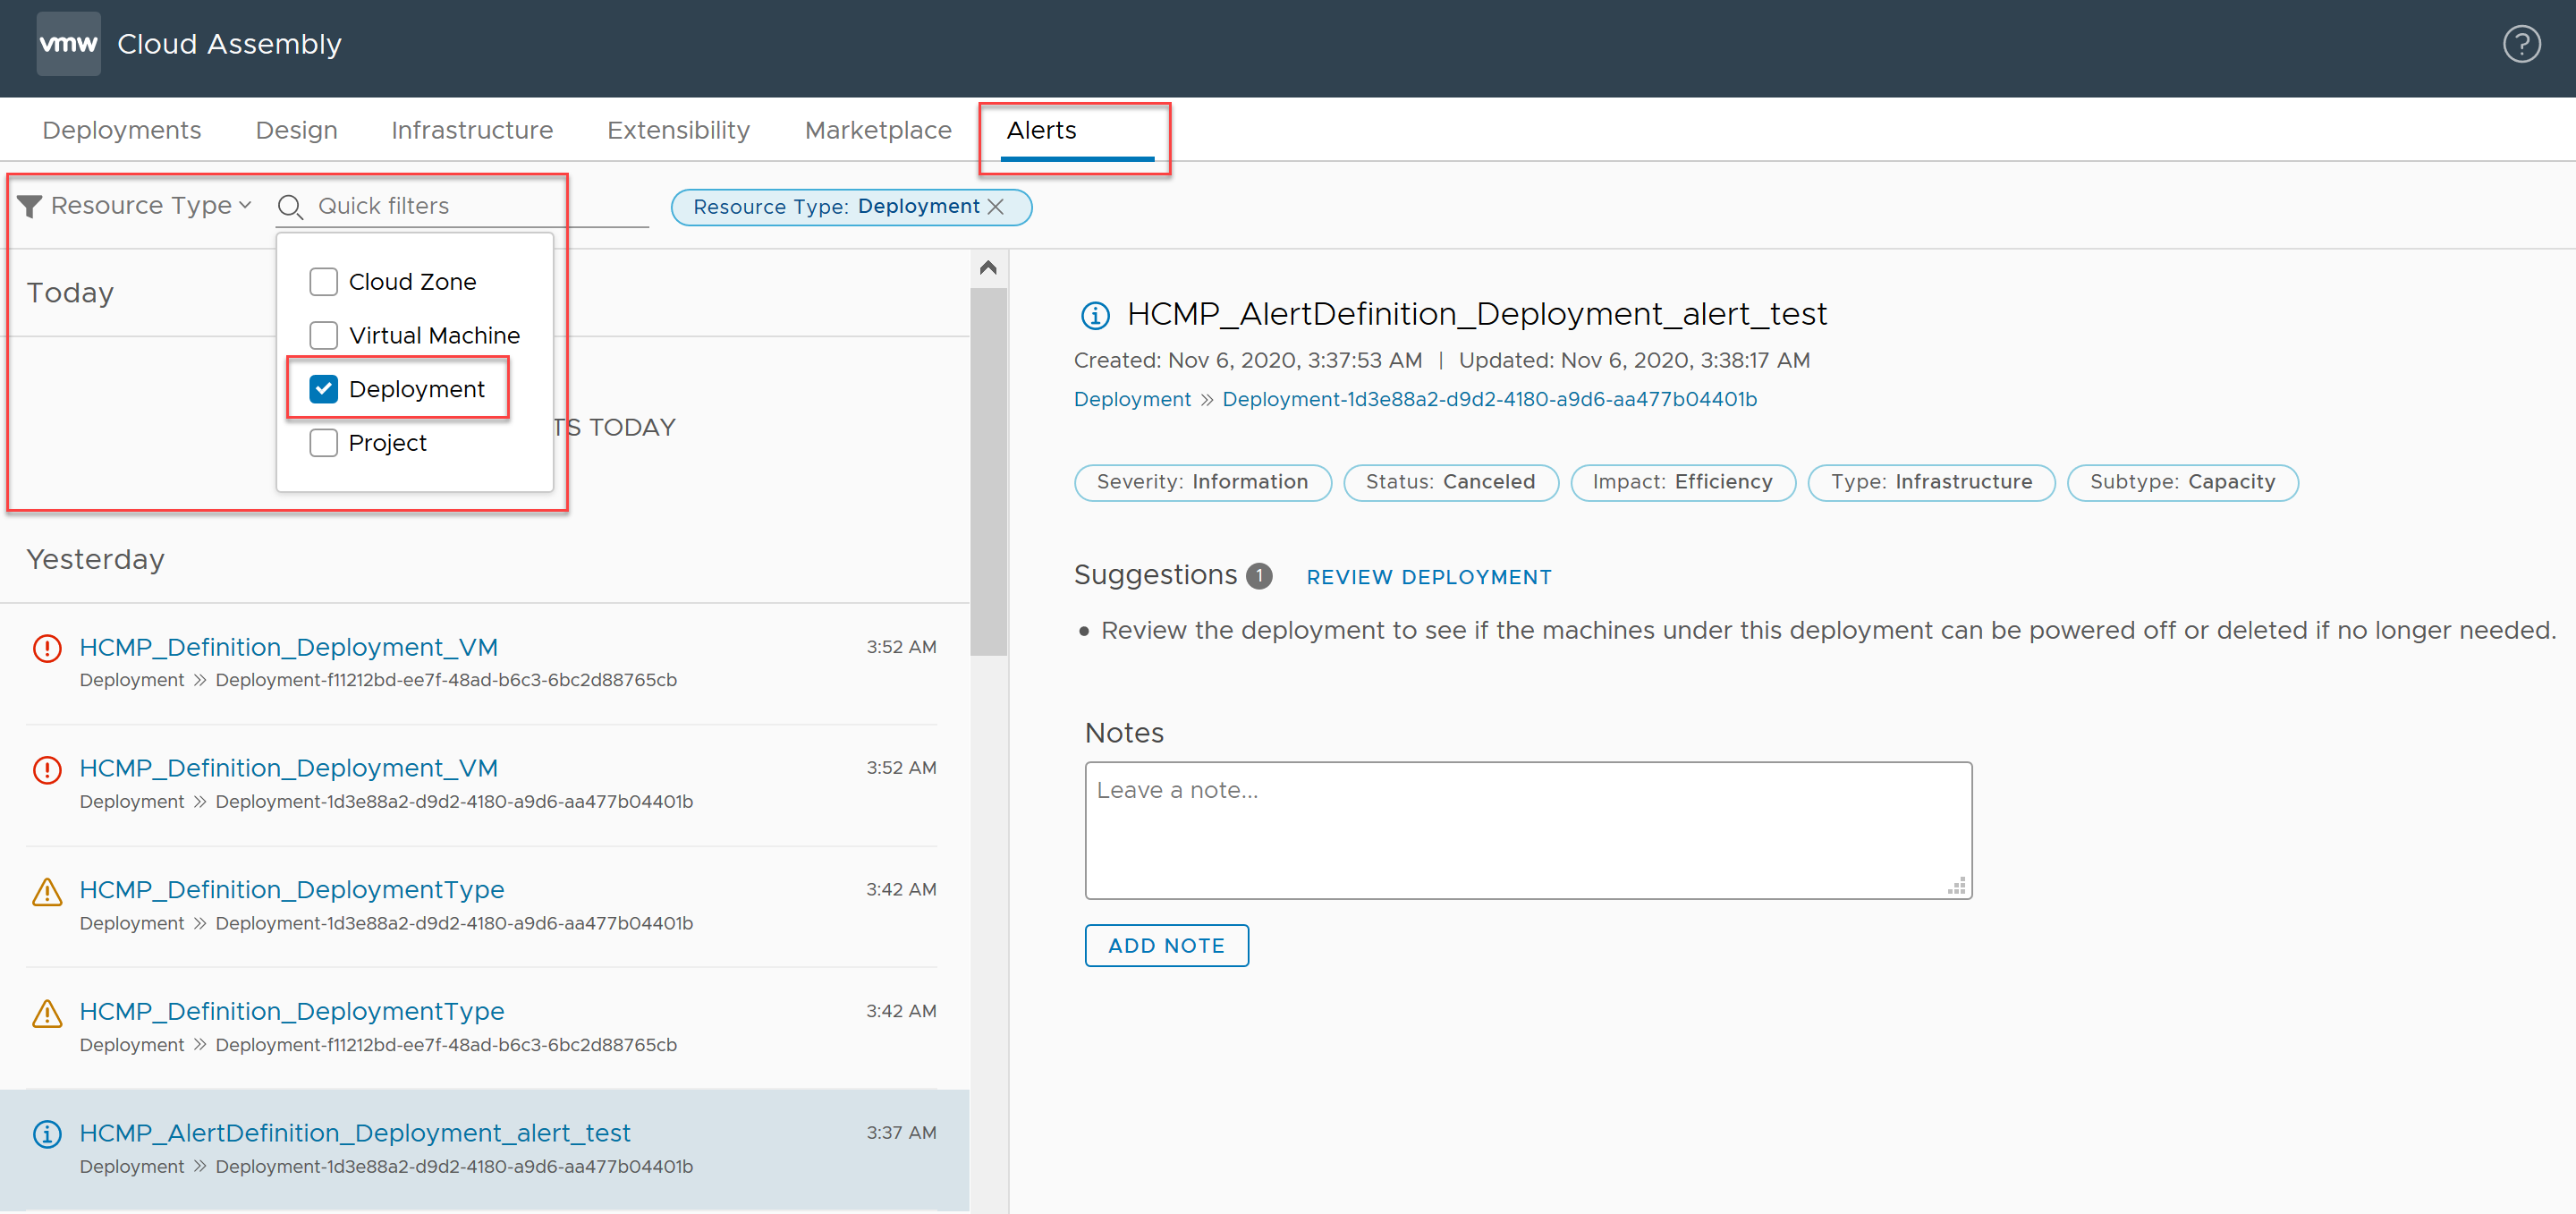
The deployment alerts pertain to reclaimable resources and right-sizing.
- Display alerts about project resources.
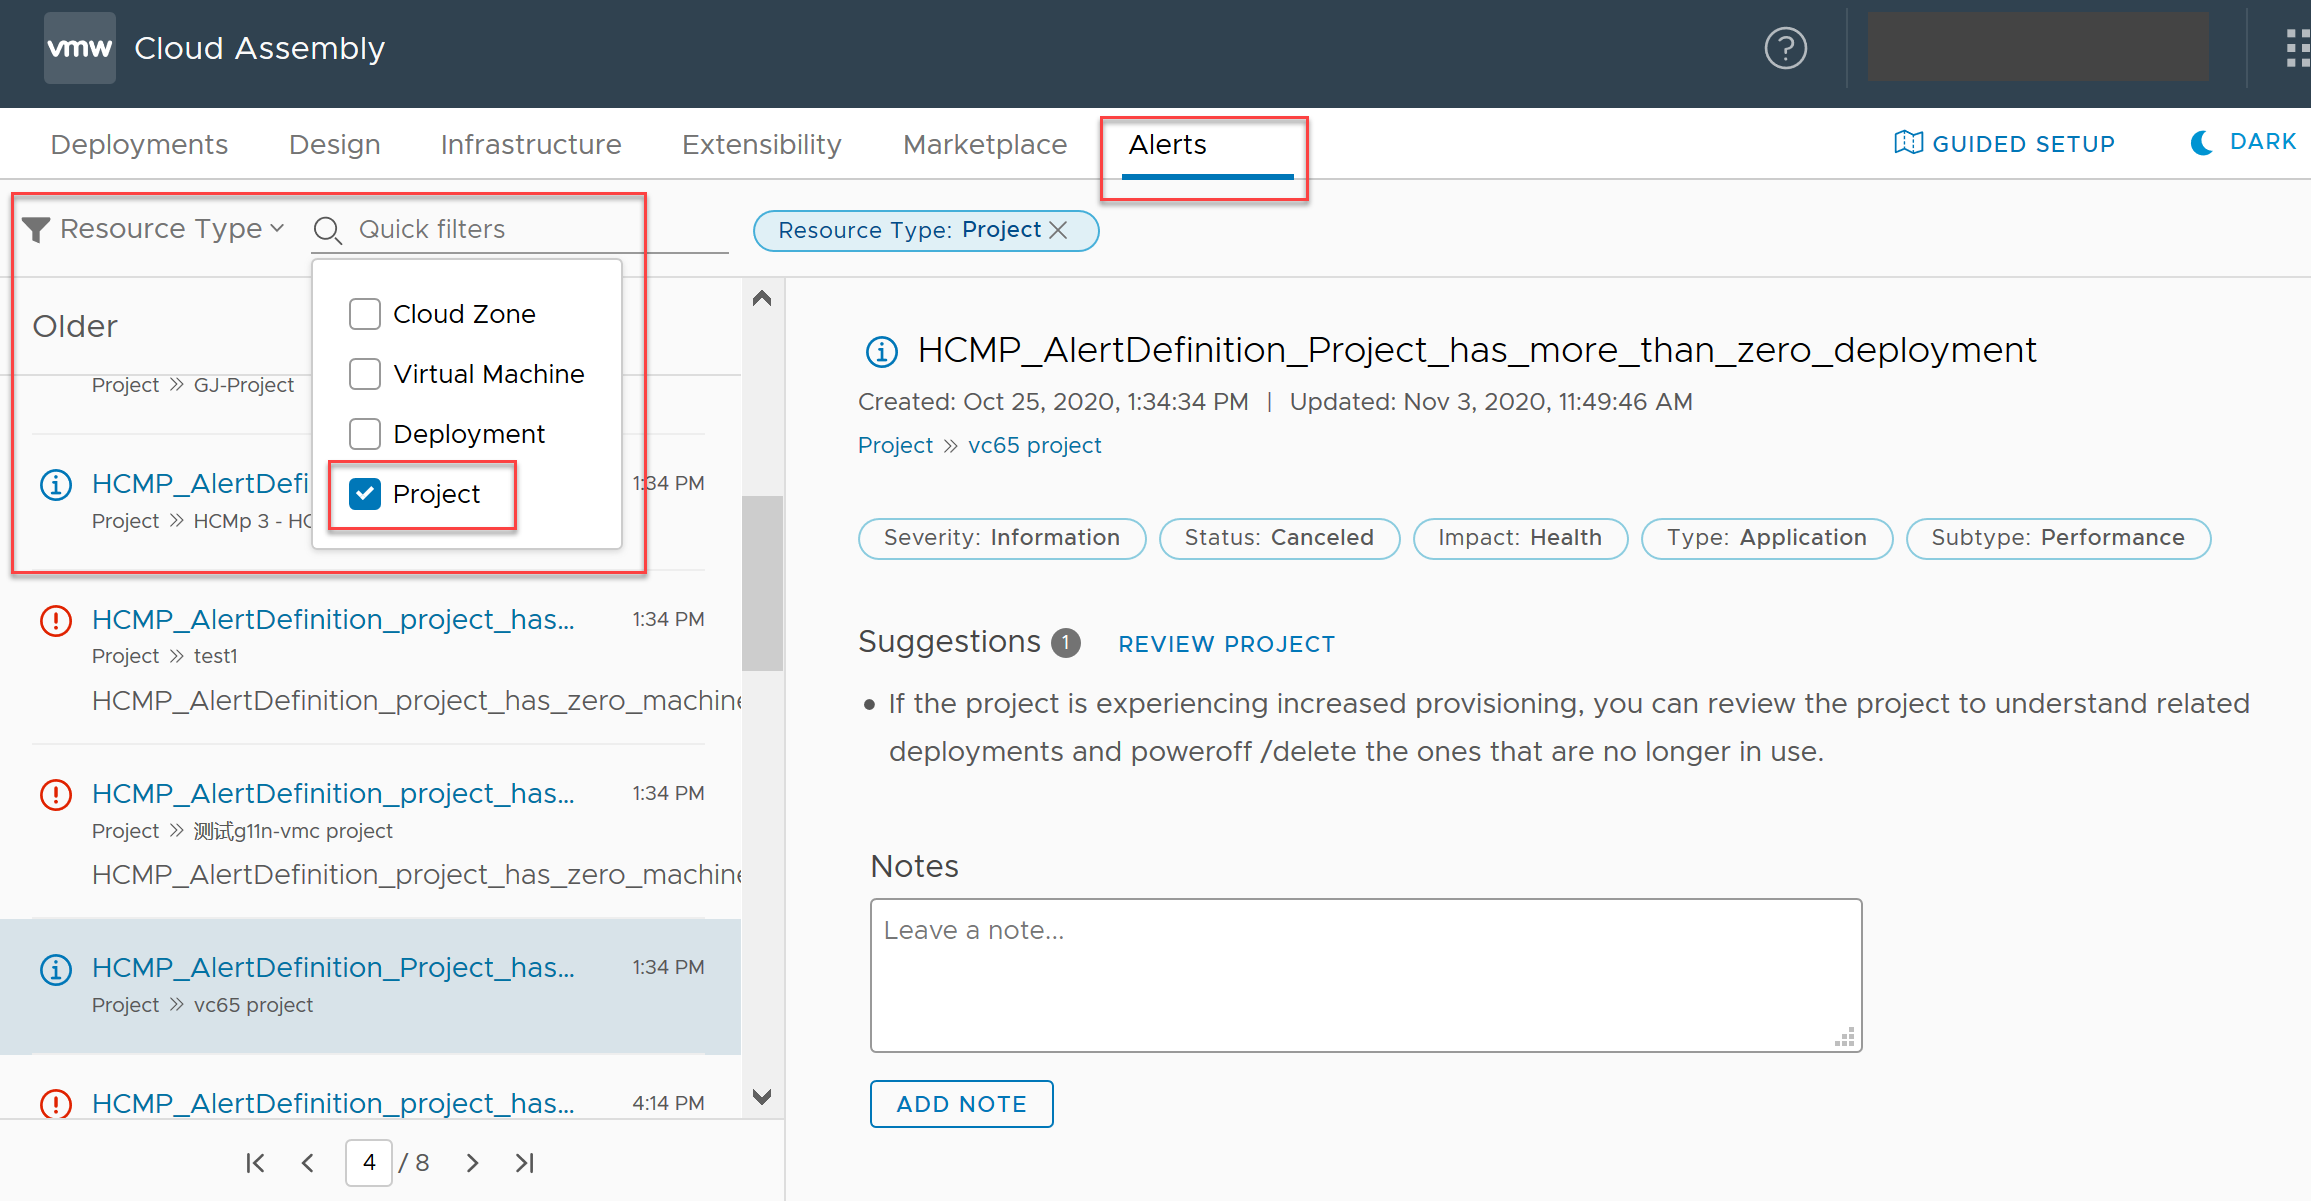
The project alerts pertain to reclaimable resources and allocation limits.
- Display alerts about cloud zone resources.
- Explore other filter types and their quick filtering options to further control the list of alerts.
- Use the Impacts quick filters of health, risk, and efficiency.
- Use the Severity quick filters of critical, immediate, warning, and information.
- Use the Status quick filters of active, cancelled, and dismissed.
- Use the Subtype filters of availability, performance, and capacity.
- Use the Type quick filters of application, hardware, infrastructure, storage, and network.
- Take any needed actions based on alerts data and suggestions.
Next steps
To learn about other actions that are available, see How to use Alerts to optimize deployments in vRealize Automation.
You can also display capacity Insights for cloud zone-based resources in projects that you manage. For information about using vRealize Operations Manager- supplied Insights data in vRealize Automation, see How to use the Insights dashboard to monitor resource capacity and notify project owners in vRealize Automation.
