Installing and Configuring the Dynatrace Service Broker
This topic explains how to install and configure the Dynatrace Service Broker tile for VMware Tanzu. The topic also describes how to set up application monitoring for the Dynatrace SaaS/Managed Service and the Dynatrace AppMon Service by creating an instance of the service and binding it to an application.
Install the Dynatrace Service Broker Tile
Install the Dynatrace Service Broker tile through your Ops Manager Installation Dashboard by performing the following steps:
-
Download the product file from Pivotal Network.
-
Upload the product file on the Ops Manager Installation Dashboard.
-
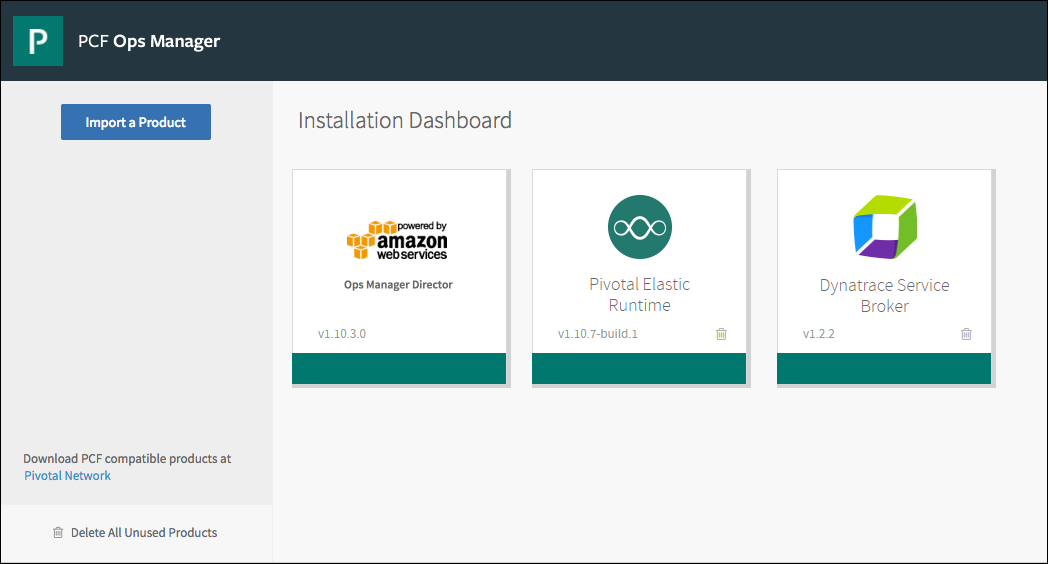
Click Add next to the uploaded Dynatrace Service Broker tile in the Ops Manager Available Products view to add it to your staging area.
-
Click the newly added Dynatrace Service Broker tile to open the configuration options. See Configure the Dynatrace Service Broker section below for configuration information.
-
Click Save.
Configure the Dynatrace Service Broker Tile
Note: The Dynatrace Service Broker tile supports both the Dynatrace SaaS/Managed Service and the Dynatrace AppMon Service. Each product contains a relevant configuration setting. Multiple Dynatrace SaaS/Managed and multiple Dynatrace AppMon environments can be simultaneously supported.
Note: Because service brokers cannot be deployed with empty service definitions, a service must be defined for both Dynatrace and Appmon. This can be a dummy entry with placeholder data.
Perform the following steps to configure the Dynatrace Service Broker tile:
-
In Pivotal Ops Manager, click the Dynatrace Service Broker tile to open its configuration options.
-
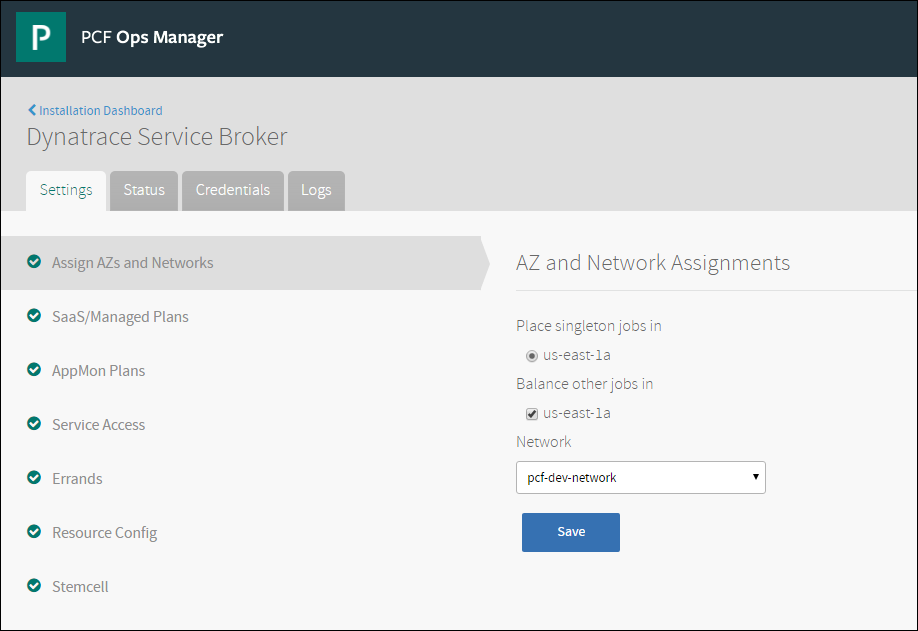
Click Assign AZs and Networks to configure the network and availability zones.
-
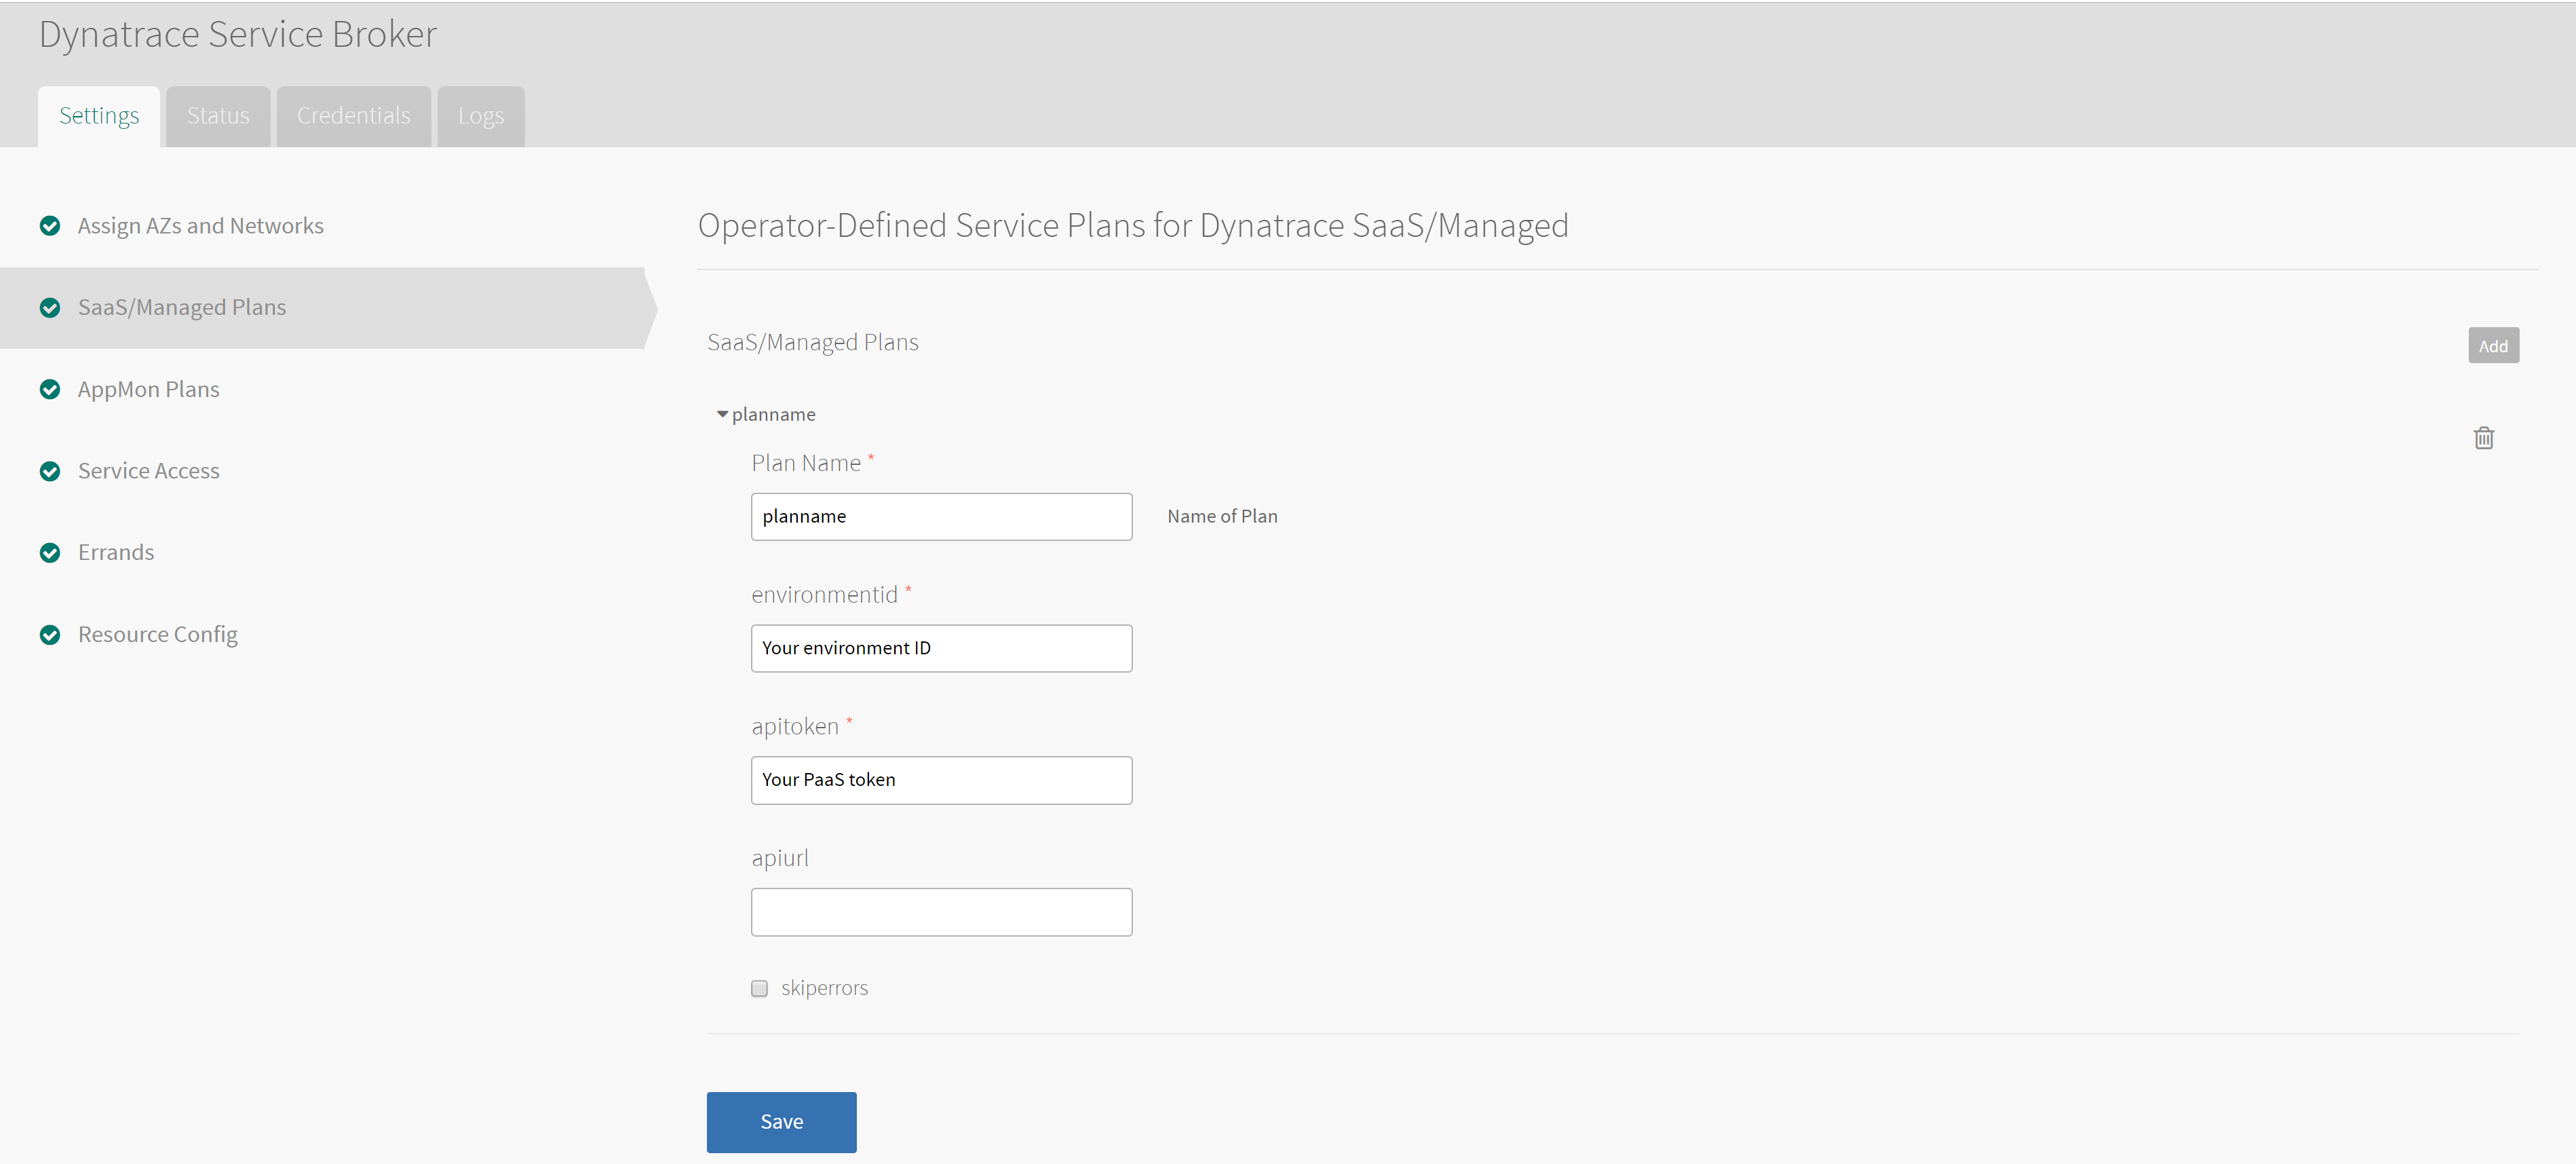
Click SaaS/Managed Plans, and click the Add button at the upper right to add a service plan.
Perform the following steps to create and configure each Service Plan:
- Enter a Plan Name.
- Complete the EnvironmentID and API token fields using the
environmentIdandtokenvalues from your Dynatrace environment. You can retrieve your Environment ID and the API token by logging in to Dynatrace and navigating to the Deploy Dynatrace -> Set up PaaS integration section.Note: The API base URL is only required for Dynatrace Managed environments.
- To skip errors during downloading the OneAgent, you can select the ‘skiperrors’ checkbox.
- Click Save.
-
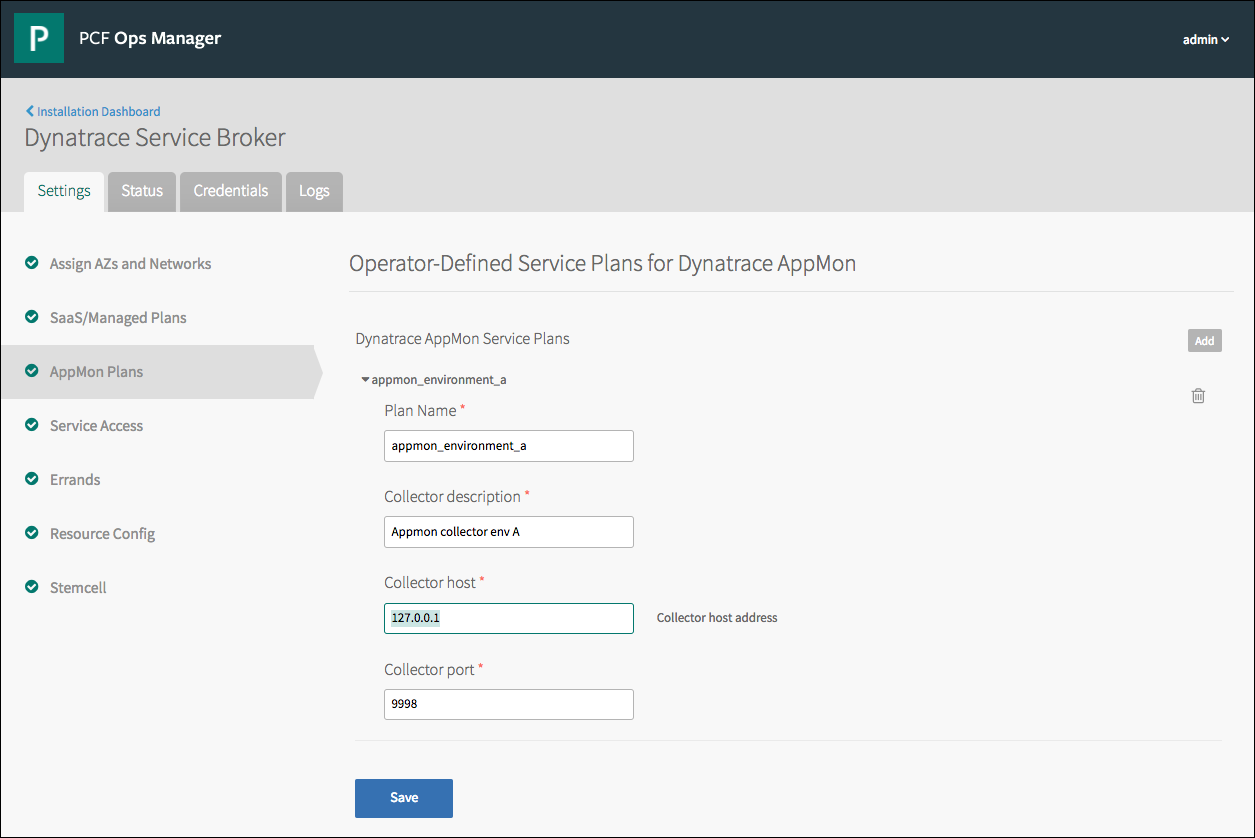
Click AppMon Plans and click the Add button at upper right to add a service plan.
Dynatrace AppMon Collector instances run remotely to collect data from the agent running on VMware Tanzu and send it to the Dynatrace servers. Perform the following steps to create and configure a Service Plan for each Dynatrace AppMon Collector instance:
- Enter a Plan Name.
- Enter a Collector description.
- Enter a Collector host and Collector port.
- Click Save.
-
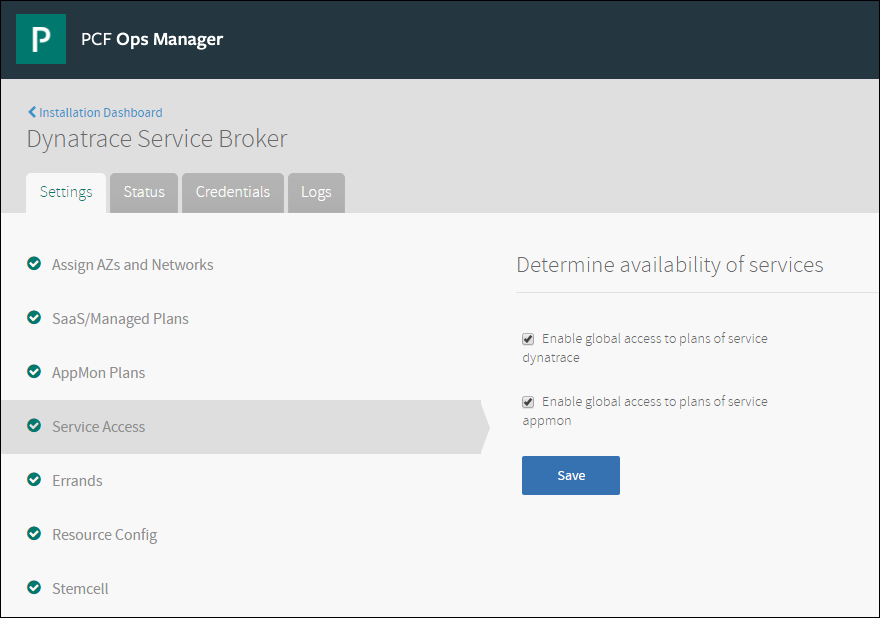
In the Service Access section, select the Enable global access… checkboxes to publish your services to all users in the Marketplace.
-
Return to the Installation Dashboard.
-
Click Apply changes.
Set Up Application Monitoring
To set up application monitoring with the Dynatrace SaaS/Managed Service, bind the service to apps in Apps Manager or using the cf CLI. After binding the service to an app, see the Using Dynatrace SaaS/Managed topic for more information about how to use the service.
To set up application monitoring with the Dynatrace AppMon Service, bind the service to apps in Apps Manager or using the cf CLI. After binding the service to an app, see the Using Dynatrace AppMon topic for more information about how to use the service.
