


This section covers the analytics that helps you assess the virtual service performance metrics. The charts and metrics reflect the selected display time.
The virtual service analytics comprises the following sections:
-
Anomalies
Alerts
Config Events
System Events
End-to-End Timing
The end-to-end timing provides an overview of the quality of the end-user experience and the occurrence of any slowdowns. The chart breaks down the time required to complete a single transaction, such as an HTTP request. It breaks total transaction time into the following components:
Field |
Description |
|---|---|
Client RTT |
Average network TCP latency between the client and Avi Load Balancer for all clients, both local (within the same data center) and remote (Internet). This metric indicates the duration it takes to establish connections and return acknowledgments. This number will often be higher than an ICMP ping. |
Server RTT |
Round-trip latency for SE-to-server traffic. An abnormally high server RTT indicates that the network is saturated or that a TCP stack cannot quickly establish new connections due to heavy load. |
App Response |
The time taken for the server to respond. It includes the time the server took to generate content, potentially fetch backend database queries, and begin transferring the response back to the Avi Load Balancer. This metric is only available for an L7 virtual service. |
Data Transfer |
Average time required for the server to transmit the requested file. It can vary greatly depending on the size of the objects requested and the latency of the server network. The larger the file, the more TCP round trip times are required due to acknowledgments (ACKs), directly impacted by the client and server RTT. This metric is only used for an L7 virtual service. |
Total Time |
Request-response time. This is the most critical end-to-end timing to watch because it is the sum of the other four metrics. If the Total Time is consistently low, the application is probably serving traffic successfully. |
Metrics Tiles
Metrics tiles continuously display time-averaged data. Clicking a particular metric tile will display the corresponding data over time in the chart. The following are the available metrics tiles:
Tile Name |
Description |
|---|---|
End-to-End Timing |
Charts the end-to-end timing by default. It governs what appears in the chart display. It displays a color-coded plotted timing to indicate the client RTT, server RTT, data transfer, and app response times at any recorded instant. |
Throughput |
Total bandwidth passing through the virtual service in Mbps. Pointing over this graph displays the throughput in Mbps for the selected time. Throughput is measured as bytes transferred between the client and SE, not including data transferred between SE and the servers. |
Open Connections |
The number of TCP client connections or UDP transactions currently in an open state. UDP transactions are counted even though they are technically connection-less. The number of open connections does not necessarily translate into the number of unique clients, as protocols such as HTTP 1.1 typically open six connections per client browser. If the Maximum Concurrent Connections setting has been set for a virtual service, a horizontal red bar superimposed over the chart pane will show the maximum number of connections allowed. For more information, see Rate Shaping and Throttling Options. |
Conns |
The average rate of connections completed per second. The tile also summarizes the percentage of connections resulting in errors. Pointing over the tile shows the rates of good, lossy, and bad connections.
|
Requests |
Number of responses to requests per second. It breaks down successful requests versus errors (such as 4xx or 5xx errors). Within the chart pane, you can toggle radio buttons to break down the errors by whether they are generated by the server or by the Avi Load Balancer. For instance, if no servers are available in the pool, Avi Load Balancer will send out an HTTP 500 status code. The Client Logs section will provide more details on specific errors. This metric is only available for HTTP virtual services. |
HTTP vs HTTP2 Requests |
Displayed as requests-per-second rates. |
For more information on the chart and overlays pane, see Chart Pane and Overlays Pane.
Anomalies Overlay
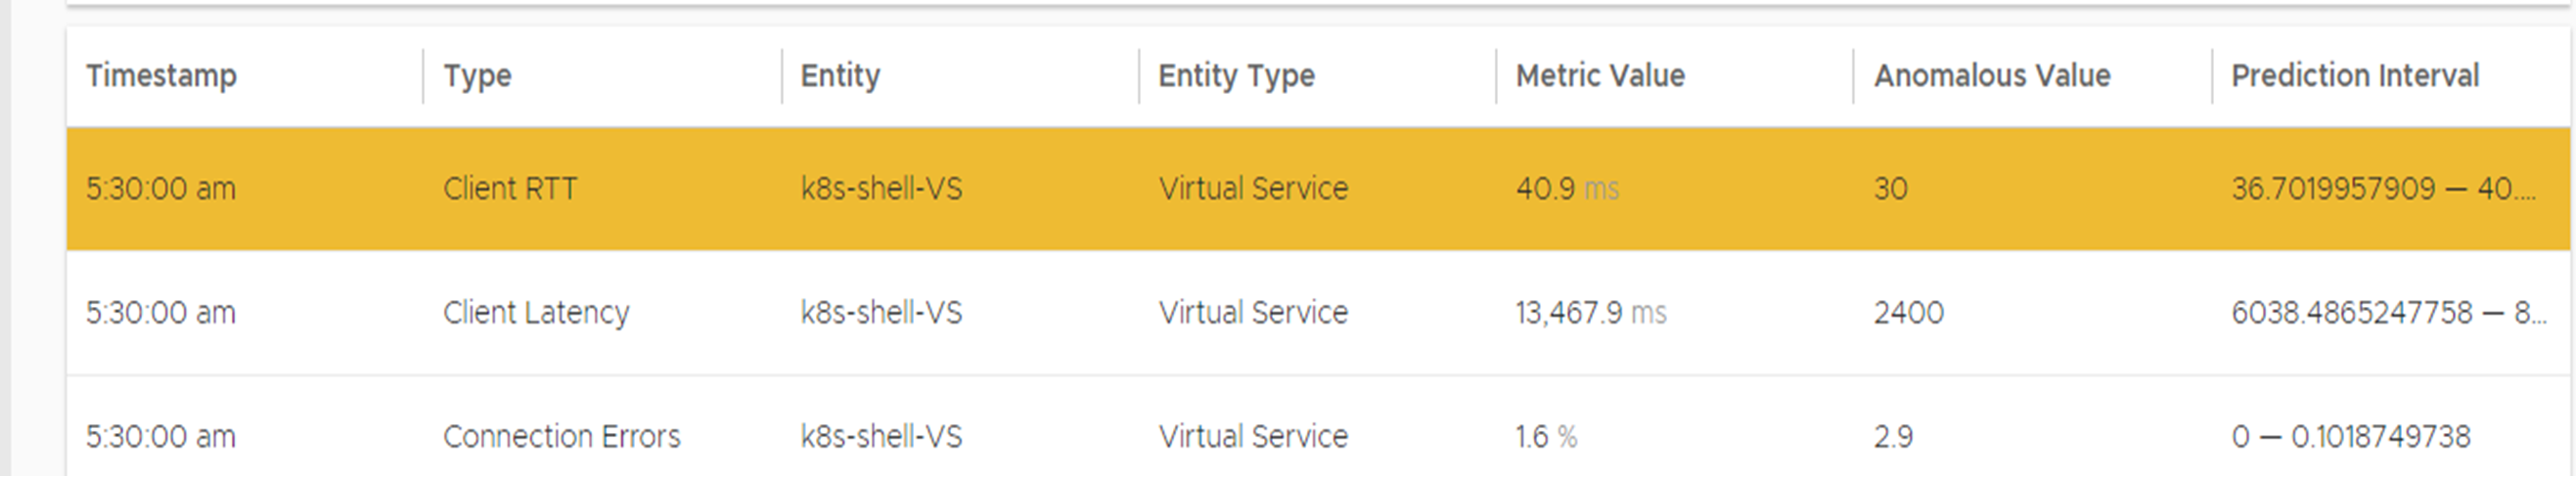
The Anomalies Overlay displays the periods of abnormal traffic detection based on its moving averages. Changing the time interval will provide greater granularity and potentially show more anomalies. Selecting the Anomalies Overlay check box displays yellow icons in the chart pane. Clicking on a yellow icon will display additional information related to that anomaly as shown below:
Name |
Description |
|---|---|
Timestamp |
Date and time when the anomaly was detected. It might either span the entire duration of the anomaly or merely be near the same time window. |
Type |
The specific metric deviates from the norm during the anomaly period. To be included, the metric deviation must be greater than 4 sigma. Numerous metrics, such as CPU utilization, bandwidth, or disk I/O might trigger anomalous events. |
Entity |
Name of the specific object that is reporting this metric. |
Entity Type |
Type of entity that caused the anomaly. This might be one of the following:
|
Metric Value |
The value of the metric. |
Anomalous Value |
Value of the anomaly. |
Prediction Interval |
An acceptable range for the metric. |
During times of abnormal traffic, the Avi Load Balancer records any deviations and provides insights into the root cause of the anomaly.
Anomalies are not recorded if the statistics interval is set to Real Time in the Displaying drop-down menu.
Alerts Overlay
Alerts Overlay displays the results of any events that meet the filtering criteria defined by . It notifies the administrators about critical information or changes to a site that requires immediate attention.
Alerts are transitory, as they will expire after a defined time. For instance, Avi Load Balancer might generate an alert if a server is down and then allow that alert to expire after a specified duration once the server is back up. The original event remains available for troubleshooting purposes later. Clicking the Alerts icon in the Overlay Items bar displays any red alerts in the chart pane. Selecting one of these chart alerts will display the below information under the Overlay Items bar:
Name |
Description |
|---|---|
Timestamp |
Indicates when the alert occurred. |
Resource Name |
Name of the object that is reporting the alert. |
Severity Level |
Determine whether additional notifications, such as sending an email to administrators or a log to Syslog servers, must be sent using the priority level. The three severity levels are:
|
Summary |
Briefly describes the event. |
Actions |
Dismiss the alert to remove it from the list and also remove the corresponding alert icon from the chart pane. Dismissing an alert here is the same as dismissing it through the bell icon at the top of the screen next to the health score or dismissing it using the Alerts tab. |
Edit |
Opens the alert filter configuration, which can be modified to make Avi Load Balancer more or less sensitive to generating new alerts. |
Expand/Contract |
Clicking the plus (+) or minus sign (-) for an alert either expands or contracts a sub-table showing more detail about the alert. This will typically show the original events that triggered the alert. |
Configuration Events Overlay
The Config Events overlay displays configuration events, such as changing the Avi Load Balancer configuration by adding, deleting, or modifying a pool, virtual service, SE, or an object related to the object being inspected. If traffic dropped off at precisely 10:00 a.m., and at that time an administrator made a change to the virtual services security settings, the cause of the change in traffic was due to the (mis)configuration.
Clicking the Config Events icon in the Overlay Items bar displays blue Config Event icons in the chart pane. Selecting one of these icons will display the following information below the Overlay Items bar:
Field Name |
Description |
|---|---|
Timestamp |
Date and time when the configuration change occurred. |
Event Type |
Always be scoped to configuration event types. |
Resource Name |
Name of the object that has been modified. |
Event Code |
There are three event codes:
|
Description |
Brief description of the event. |
+/- (Expand/Contract) |
Expands or contracts a sub-table showing additional detail about the event. When expanded, It shows a color-coded comparison of the previous configuration and the new configuration, as follows:
|
System Events Overlay
This overlay displays the system events relevant to the current object, such as a server changing status from UP to DOWN or the health score of a virtual service changing from 50 to 100.
Clicking the System Events icon in the Overlay Items bar displays System Event icons in the chart pane. Clicking any System Event icon in the chart pane displays a detailed table of information with the below columns:
Field Name |
Description |
|---|---|
Timestamp |
Date and time when the system even occurred. |
Resource Name |
Name of the object that triggered the event. |
Resource Type |
Type of resource involved, e.g., virtual service, pool, pool server, and so on. |
Event Code |
High-level definition of the event, such as |
Description |
Brief of the system event. |
+/- |
Expands or contracts the detailed information of an event. |
