After you perform a search query on the Observations page and retrieve the data set in which you are interested, the results display in tabular format.
Options for viewing are as follows:
- Export this data by clicking the Export button at the top right of the table.
- Group and view results as described in Group By and View By.
- Sort the table by using the sorting carets next to most column headers.
- Customize the columns that display by clicking the Configure Table button at the bottom left of the table.
To view an Observation's process and all its events, click the Process Analysis  icon at the right of the row. See Exploring XDR Data on the Process Analysis Page and Process Analysis.
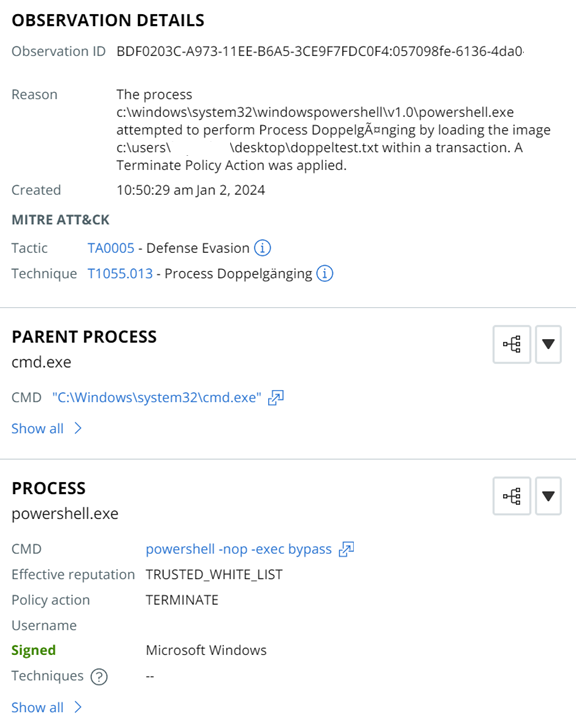
To view additional details about an event, click the  at the right of the row. A summary of details displays. Click Show all in any section to view all details in that category. For example:

From this panel, you can view binary details of the event, open the Process Analysis page, or take actions on the event.
Available actions on the executable are:
- Remove hash from approved list or Remove hash from banned list
- Add hash to banned list or Add hash to approved list
- Request upload
- Find in VirusTotal
- Delete application
Available actions on the device are:
- Enable bypass
- Quarantine asset
- Go live