


You can monitor datastore health by viewing a running list of all events that occur in system, both system-generated events and user actions, as well as running tasks and alarms.
From the Monitor page you can view at a high level the overall health of your datastores, and quickly see which ones need attention.
You can filter the Events list by:
- Event category, such as user operations ("Audit"), or any even related to datastores, such as creating, deleting, mounting clusters, or unmounting clusters.
- Event severity such as Info, Warning, Error, Emergency.
- Event duration, such as Today, Last 24 hours, Last 7 days, or any specific time frame you select.
You can also filter the events list page results further by text strings. This search filters the currently displayed list of events in the UI based on the entered text.
Event Severities
| Severity |
Description |
|---|---|
| Info |
Descriptive information about an operation or state of the system, including information that might be useful. For example, Info severity events include such things as a user logging in to the system, a host mounting successful to a datastore, a datastore recently added is ready to use, and more. |
| Warning |
Indicates a situation that requires attention. A warning condition does not affect system operation. One example of a Warning event is when a datastore goes offline. |
| Error |
Indicates that an operation failed or that there was a hardware error. An error condition does not affect continued system operation. Some examples of Error events include if a component cannot communicate with another (backend authentication error), if a cluster fails to mount to or a datastore |
| Emergency |
Indicates that a fatal event occurred. A fatal event affects continued system operation. |
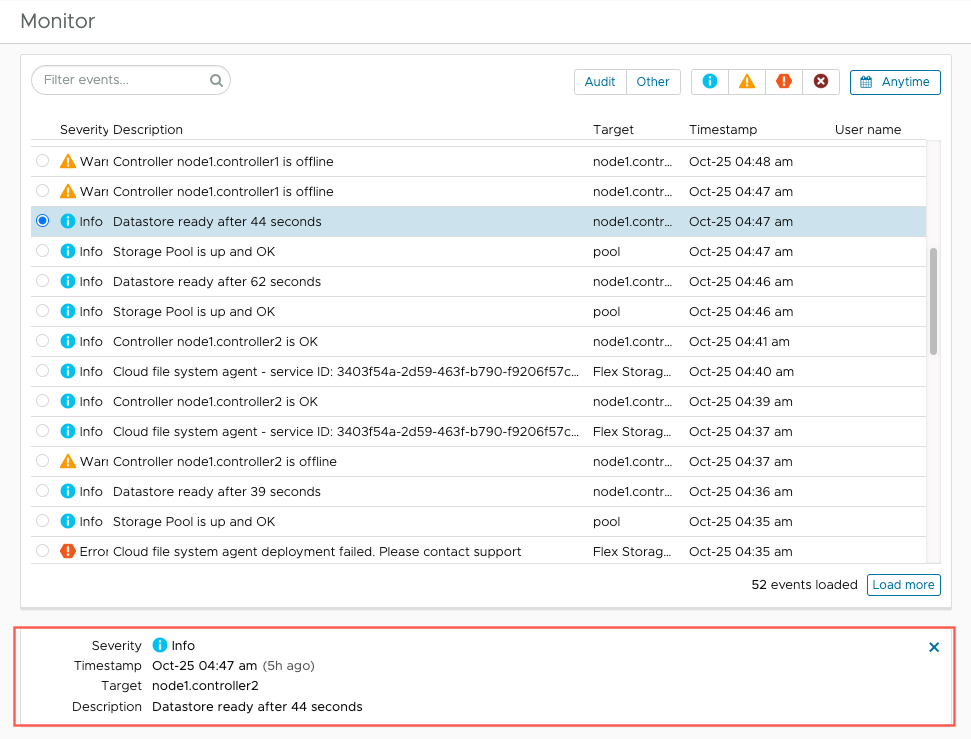
Event Details
When you select an event, a details panel opens to show more information about the event, such as event severity, description, timestamp, target system:
Tasks and Alarms
Tasks are currently running operations, such as creating and deleting datastores or mounting and unmounting a datastore from a cluster.
Alarms include all issues that require your attention. Events trigger alarms when something did not occur as planned in the event. You can search the alarms list and also filter it by severity.
You can clear alarms by clicking the small X at the far right of the alarm entry. If you click the small X at the top of the column, it clears all alarms. To see cleared alarms, select the 'Show cleared alarms' option.
