


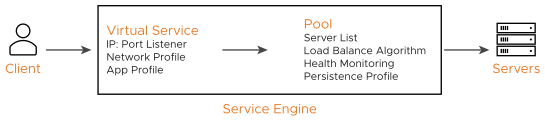
Virtual services are the core of the load balancing and proxy functionality. A virtual service advertises an IP address and one or more ports to the client-facing network, and listens for traffic. When a virtual service receives traffic, it can be configured to:
Proxy the client’s network connection.
Perform security, acceleration, load balancing, gather traffic statistics, and other tasks.
Forward the client’s request data to the destination pool for load balancing.
A virtual service can be thought of as an IP address that the NSX Advanced Load Balancer is listening to, ready to receive requests. In a normal TCP/ HTTP configuration, when a client connects to the virtual service address, NSX Advanced Load Balancer will process the client connection or request against a list of settings, policies, and profiles, then send valid client traffic to a back-end server that is listed as a member of the virtual service’s pool.
Typically, the connection between the client and NSX Advanced Load Balancer is terminated or proxied at the SE, which opens a new TCP connection between itself and the server. The server will respond directly to the NSX Advanced Load Balancer IP address, not to the original client address. NSX Advanced Load Balancer forwards the response to the client through the TCP connection between itself and the client.
A typical virtual service consists of a single IP address and service port that uses a single network protocol. NSX Advanced Load Balancer allows a virtual service to listen to multiple service ports or network protocols.
For instance, a virtual service could be created for both service port 80 (HTTP) and 443 SSL (HTTPS). In this example, clients can connect to the site with a non-secure connection and later be redirected to the encrypted version of the site. This allows administrators to manage a single virtual service instead of two. Similarly, protocols such as DNS, RADIUS and Syslog can be accessed using both UDP and TCP protocols.
It is possible to create two unique virtual services, where one is listening on port 80 and the other is on port 443; however, they will have separate statistics, logs, and reporting. They will still be owned by the same Service Engines (SEs) because they share the same underlying virtual service IP address.
To send traffic to destination servers, the virtual service internally passes the traffic to the pool corresponding to that virtual service. A virtual service normally uses a single pool, though an advanced configuration using policies or DataScripts can perform content switching across multiple pools. A script also can be used instead of a pool, such as a virtual service that only performs an HTTP redirect.
A pool can be associated with multiple virtual services if they have the same Layer 4 or 7 application profile.
When creating a virtual service, that virtual service listens to the client-facing network, which is most likely the upstream network where the default gateway exists. The pool connects to the server network.
Normally, the combined virtual service and pool are required before NSX Advanced Load Balancer can place either object on an SE. When making an SE placement decision, NSX Advanced Load Balancer must choose the SE that has the best reachability or network access to both client and server networks. Alternatively, both the clients and servers may be on the same IP network.
A virtual service will be available and accept client traffic if one of the following conditions is met:
At least one of the pools associated to the virtual service is up.
A policy (for example, a redirect policy) associated with the virtual service that does not need a pool.
A DataScript attached to the policy.
The virtual service is associated to a policy that sends a local response.
Viewing Virtual Services
From the NSX Advanced Load Balancer UI, navigate to , to view all the virtual services created. From this screen, you can create a new virtual service, search for existing virtual services, edit or delete virtual services.
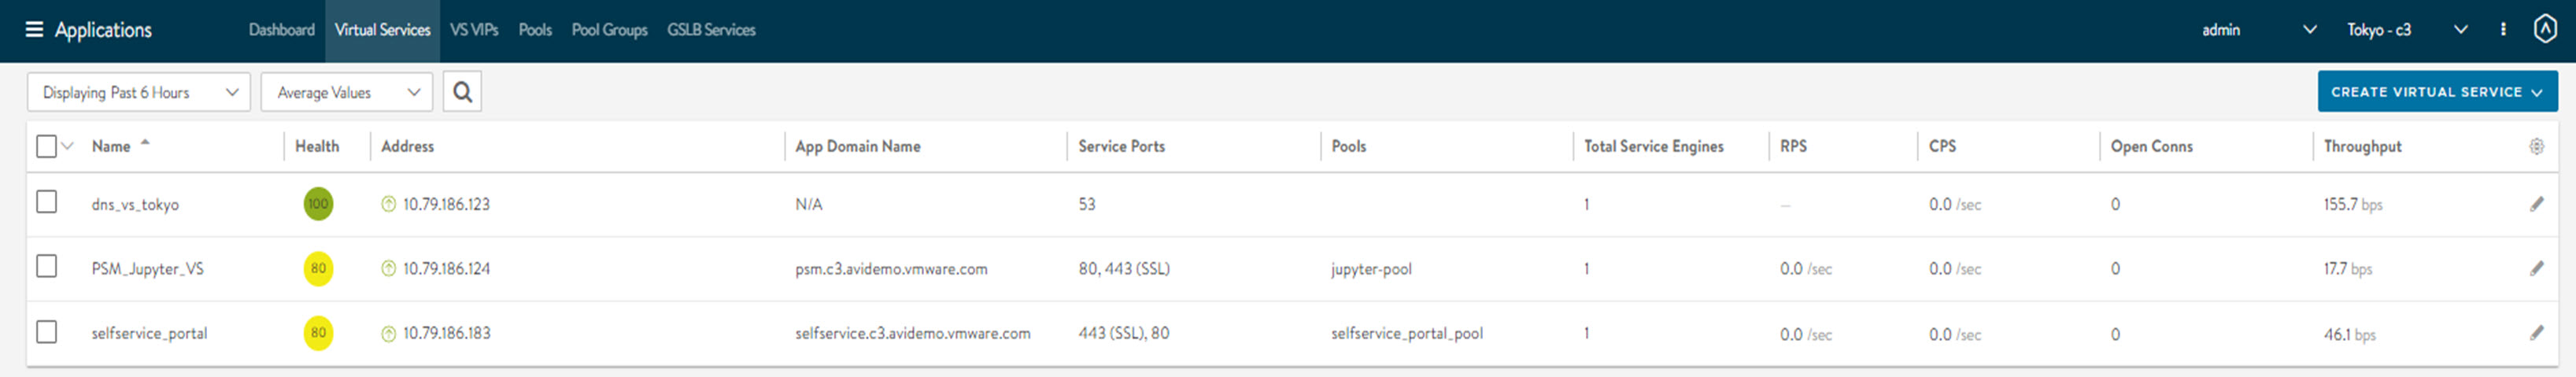
Field |
Description |
|---|---|
Name |
Lists the name of each virtual service. Clicking the name of a virtual service opens the Analytics tab of the respective virtual service. |
Health |
Displays a numeric, color-coded health status of the virtual service. A red exclamation mark (!) indicates that the virtual service is down. A dash appears if the virtual service is disabled, not deployed, or in error state. Hover the mouse pointer over the health score to view the Health Score popup for the virtual service. Click the View Health button at the bottom of the popup screen to view more insights on the health status. |
Address |
Displays the IP address advertised by the virtual service. |
Service Ports |
Lists the service ports configured for the virtual service. Ports that are configured for terminating SSL/TLS connections are denoted in parenthesis. A virtual service may have multiple ports configured. For example:
|
Pools |
Lists the pools assigned to each virtual service. Clicking a pool name opens the Analytics tab of the respective pool. |
Service Engine Group |
Displays the group from which Service Engines may be assigned to the virtual service. |
Service Engines |
Lists the Service Engines to which the virtual service is assigned. Clicking a Service Engine name opens the Analytics tab of the respective Service Engine. |
Total Service Engines |
Shows the number of SEs assigned to the virtual service as a time series. This is useful to see if a virtual service scales up or down the number of SEs. |
Throughput |
Displays a thumbnail chart of the throughput for each virtual service for the time frame selected. Hovering the mouse pointer over this graph shows the throughput for the highlighted time. Clicking a graph opens the Analytics tab of the virtual service. |
Open Conns |
Displays the average number of open connections. |
Client RTT |
Displays the average TCP latency between clients of the virtual service and the respective SEs. |
Server RTT |
Displays the average TCP latency between backend servers of the virtual service and its SEs. |
Conns |
Displays the rate of total connections per second. |
Bad Connections |
Displays the rate of connection errors per second. |
RX Packets |
Displays the average rate of packets received per second. |
TX Packets |
Displays the average rate of packets transmitted per second. |
Policy Drops |
Displays the rate of total connections dropped due to virtual service policies (per second). It includes drops due to rate limits, security policy drops, connection limits, etc. |
DoS Attacks |
Displays the number of DoS attacks occurring per second. |
Alerts |
Displays the number of alerts related to the virtual service, pool, or Service Engines. |
Virtual Service Details
The Virtual Services screen shows extensive information about the virtual service selected.
To view the details of a specific virtual service, navigate to . Click the required virtual service.
Alternatively, you can also navigate to . Click the required virtual service.
The Virtual Service screen has the following tabs for the virtual service selected.
Virtual Service Analytics
Virtual Service Application Logs
Virtual Service Health
View Security Insights
Virtual Service Events Page
Virtual Service Alerts Page
Virtual Service DNS Records
Virtual Service Quick Info Popup
You can view the Virtual Service quick info pop up from any tab of the Virtual Service screen. Hover over or click the virtual service name.
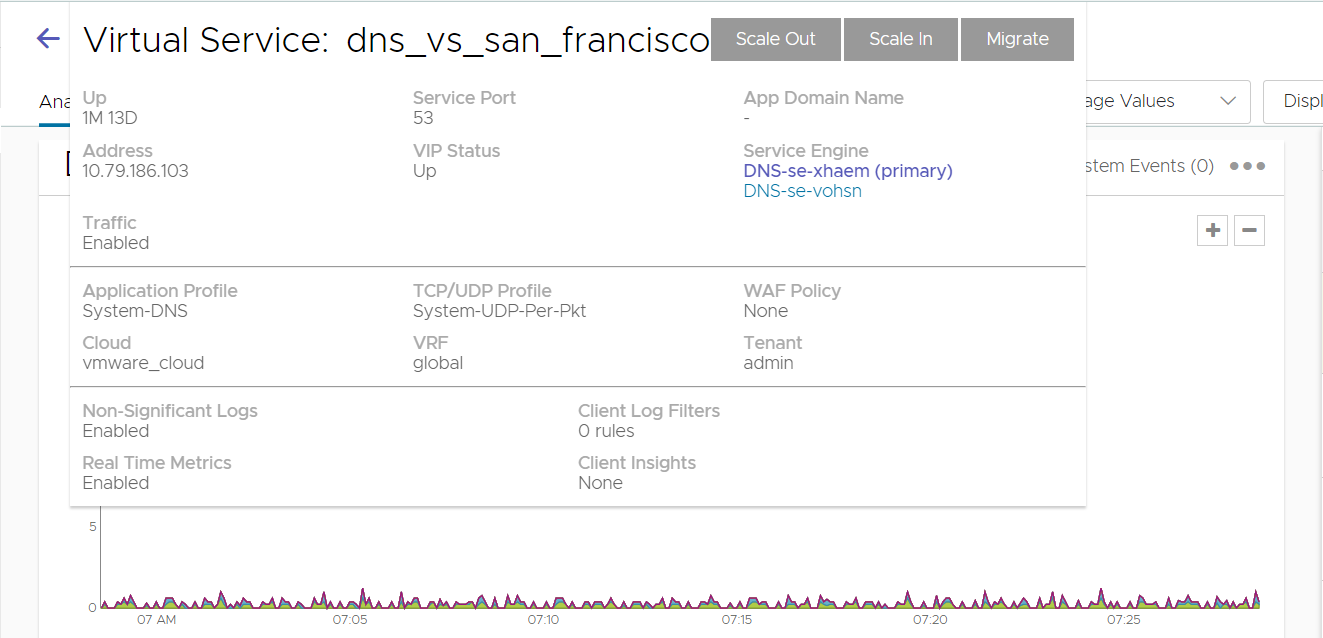
The Virtual Service quick info popup has the following buttons:
Scale-Out distributes connections for the virtual service to one additional SE per click, up to the maximum number of SEs defined in the SE group properties.
Scale In removes the VIP address from the selected Service Engine. If primary is selected, one of the existing secondaries will become the new Primary.
Migrate moves the virtual service from the SE it is currently on to a different SE within the same SE group.
For information related to the SE group settings min_scaleout_per_vs and max_scaleout_per_vs, see Impact of Changes to Min-Max Scaleout Per Virtual Service.
This popup also displays the following information (if applicable) for the virtual service:
Field |
Description |
|---|---|
Service Engine |
Names or IP addresses of the SEs this virtual service is deployed on. Clicking on an SE name opens the Service Engine Details page for that SE. |
Uptime / Downtime |
The duration for which the virtual service has been in the current state up or down. |
Address |
IP address of the virtual service. |
Application Profile |
The application profile applied to the virtual service. |
Service Port |
Service ports on which the virtual service is listening for client traffic. |
TCP/UDP Profile |
The profile is applied to the virtual service. |
SSL Certificates |
The certificates applied to the virtual service. |
Non-Significant Logs |
When disabled, the virtual service defaults to logging significant events or errors. When enabled, all connections or requests are logged. |
Real-Time Metrics |
When this option is disabled, metrics are collected every five minutes, regardless of whether the Display Time is set to Real-Time. When the option is enabled, metrics is collected every 15 seconds. |
Client Log Filters |
Number of custom log filters applied to the virtual service. Log filters can selectively generate non-significant logs. |
Client Insights |
Type of client insights gathered by the virtual service: Active, Passive, or None. |
