You can view the different information about discovered and configured APIs in Tanzu Service Mesh, including the API specification (the API endpoints), the security analytics, the performance metrics, and the API health scores.

Tanzu Service Mesh creates a discovered API by capturing HTTP traffic between microservices internal and external to the service mesh and generating a custom API schema from the captured HTTP traffic, which is similar to OpenAPI. A discovered API is associated with a specific microservice whose API traffic was captured and has the same name as that microservice. For more information about discovered APIs, see API Discovery.

Tanzu Service Mesh creates a configured API based on a configuration that points to a GitHub repository and a branch where the API specification and other API documents are stored. For more information about configured APIs, see Configured APIs.

On the API Management page in Tanzu Service Mesh, you can view the following API-related information:

  • The contents of the API specification (the endpoints that the API exposes)

  • (Only configured APIs) the automatically generated Documentation Health, OpenAPI, Security, and Governance scores that indicate the quality and health of the API specification

  • (Only configured APIs) the configuration of a configured API

  • (Only discovered APIs) The security analytics, operational metrics, and performance metrics for each endpoint

  • The API schema for each endpoint

  • The API logs for each endpoint

You can also add API documents for a configured API to Tanzu Service Mesh if you selected the No API Documents option when you were creating that API. Tanzu Service Mesh will read the API specification and other documents (if selected) from the GitHub repository and display the contents of the API specification. For more information about creating a configured API, see Configure an API.

The following procedure explains how to view the API information on the API Management page. It also includes instructions on how to add API documents for a configured API.

Prerequisites

Procedure

  1. In the navigation pane on the left, click API Management.

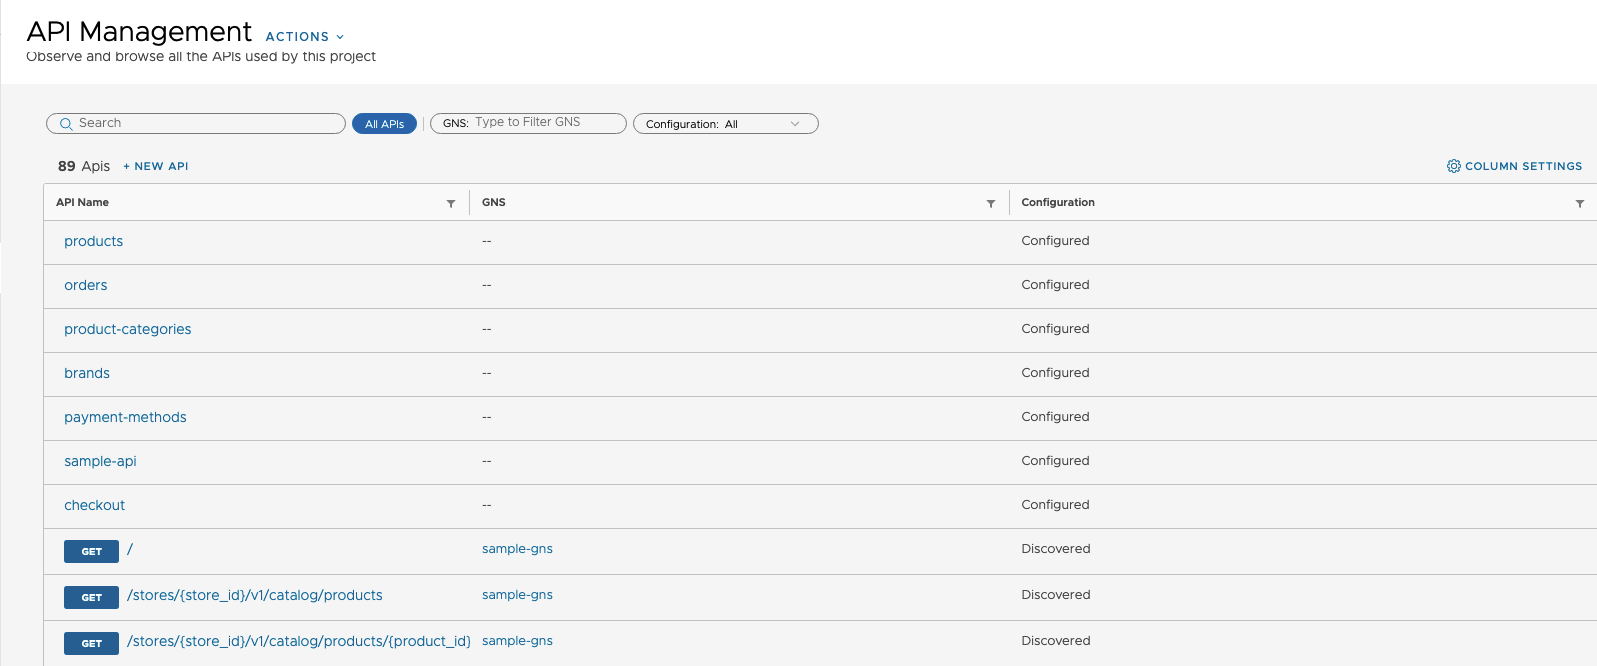
    The table on the API Management page displays all discovered and configured APIs in Tanzu Service Mesh, as shown below. The Configuration column identifies whether this is a discovered or configured API.

    For a discovered API, the API Name column displays the name of the associated microservice that has API endpoints, and the GNS column displays the name of the global namespace that the associated microservice is part of.

    For a configured API, the API Name column displays the name of the API.

    You can filter the APIs by using the filters at the top. You can view all the APIs, only the APIs where the associated microservices belong to a selected global namespace by using the GNS filter, or only the discovered API or only the configured APIs by using the Configuration filter.


    Note:

    You can use the New API button to configure an API.

  2. (Only discovered APIs) To view the details of all the endpoints of a discovered API, in the table on the API Management page, click the microservice name.

    The API details page displays the following general details about the API:

    • The name of the microservice associated with the API

    • The description of the API

    • The type of API (Discovered)

    • The name of the global namespace that the associated microservice is part of

    The API Overview tab displays the security analytics (including statistics on and details of security events), the operational metrics (including the top five workloads consuming the API, the top five error codes, and the top five response codes), and the performance metrics (including the request rate and latency metrics) for a selected endpoint.

    On the API Schema tab, you can view the request, response, and JSON code for a selected endpoint. By clicking the copy icon at the right, you can copy the JSON code. Since the copied JSON code is compliant with the OpenAPI standard, it is Swagger-compatible.

    On the API Logs tab, you can view counts of logged API messages in a graph form over a selected period and details of the log messages in a table below.

  3. (Only configured APIs) To view the details about a configured API and its API specification, click its name in the table.

    The API details page displays the following general details about the API:

    • The description of the API

    • The name of the primary API document from which the API specification was created

    • The URL of the GitHub repository and the primary branch in the repository where the API documents are stored

    • The name of the associated GitHub integration account

    The API Specification tab displays the collection of endpoints (paths) exposed by the API. For a configured API, the API Specification Contents panel on the left shows the primary API document and the reference and extension API documents, if any. When you select an API document, the endpoints defined in that document are displayed.

    Note:
    • If any breaking changes were introduced to the API specification in the branch where it is stored in the GitHub repository, the warning Breaking Changes Detected in selected branch Specification appears at the top of the page. To view the details of what caused the breaking changes on the Validation tab, click Show Errors. For more information, see View the API Validation and Scoring.

    • Validation number % at the top of the page indicates the aggregate security score for the selected configured API. When you click this drop-down menu, the individual API scores are displayed. For more information about the API scores, see View the API Validation and Scoring.

    • You can click the Actions drop-down menu at the top of the page and then click Edit to edit the API configuration in the Configure API wizard. For more information about editing an API configuration, see View and Edit the Configuration of a Configured API.

    • Clicking Publish to Catalog at the top of the page creates a version of the API specification that is stored internally in Tanzu Service Mesh. Tanzu Service Mesh compares the version of the API specification in the GitHub repository with the internal version to check the API specification for breaking changes and to generate an Governance score. For more information about the Governance score and viewing details about any breaking changes found, see View the API Validation and Scoring.

    • Clicking Show Activity Feed in the upper-right corner opens the Activity Feed panel where you and other developers can add and reply to comments on the API specification and the API scores. For more information, see Collaborate on an API.

  4. (Only configured APIs) View the Documentation Health, OpenAPI, Security, and Governance scores generated for the API specification on the Validation tab.

    For more information about the API scores, see View the API Validation and Scoring.

  5. (Only configured APIs) View or edit the API configuration on the Configuration tab.

    For more information about viewing and editing the API configuration, see View and Edit the Configuration of a Configured API.

  6. (Optional, only configured APIs) To add API documents for a configured API, perform the following steps:
    1. On the API Specification tab of the API details page, click Configure API Documents.
    2. In the Configure API Documents dialog box, select the primary API document and optionally select API reference and extension documents. To add a new document, click Add Document.

      The drop-down menus in the Configure API Documents dialog box display the API documents from the branch in the GitHub repository selected in the API configuration of the configured API. For more information, see Configure an API.

    3. Click Save.

      Tanzu Service Mesh will read the API definition from the API documents and display the endpoints on the API Specification tab of the API details page.

  7. To view the security analytics, operational metrics, performance metrics, the API schema, and the API logs for an endpoint in the API, on the API Specification tab, click that endpoint.

    The API Overview tab of the endpoint details page displays the security analytics (including statistics on and details of security events), the operational metrics (including the top five workloads consuming the API, the top five error codes, and the top five response codes), and the performance metrics (including the request rate and latency metrics) for the endpoint.

    On the API Schema tab, you can view the request, response, and JSON code for the endpoint. By clicking the copy icon at the right, you can copy the JSON code. Since the copied JSON code is compliant with the OpenAPI standard, it is Swagger-compatible.

    On the API Logs tab, you can view counts of logged API messages in a graph form over a selected period and details of the log messages in a table below.