


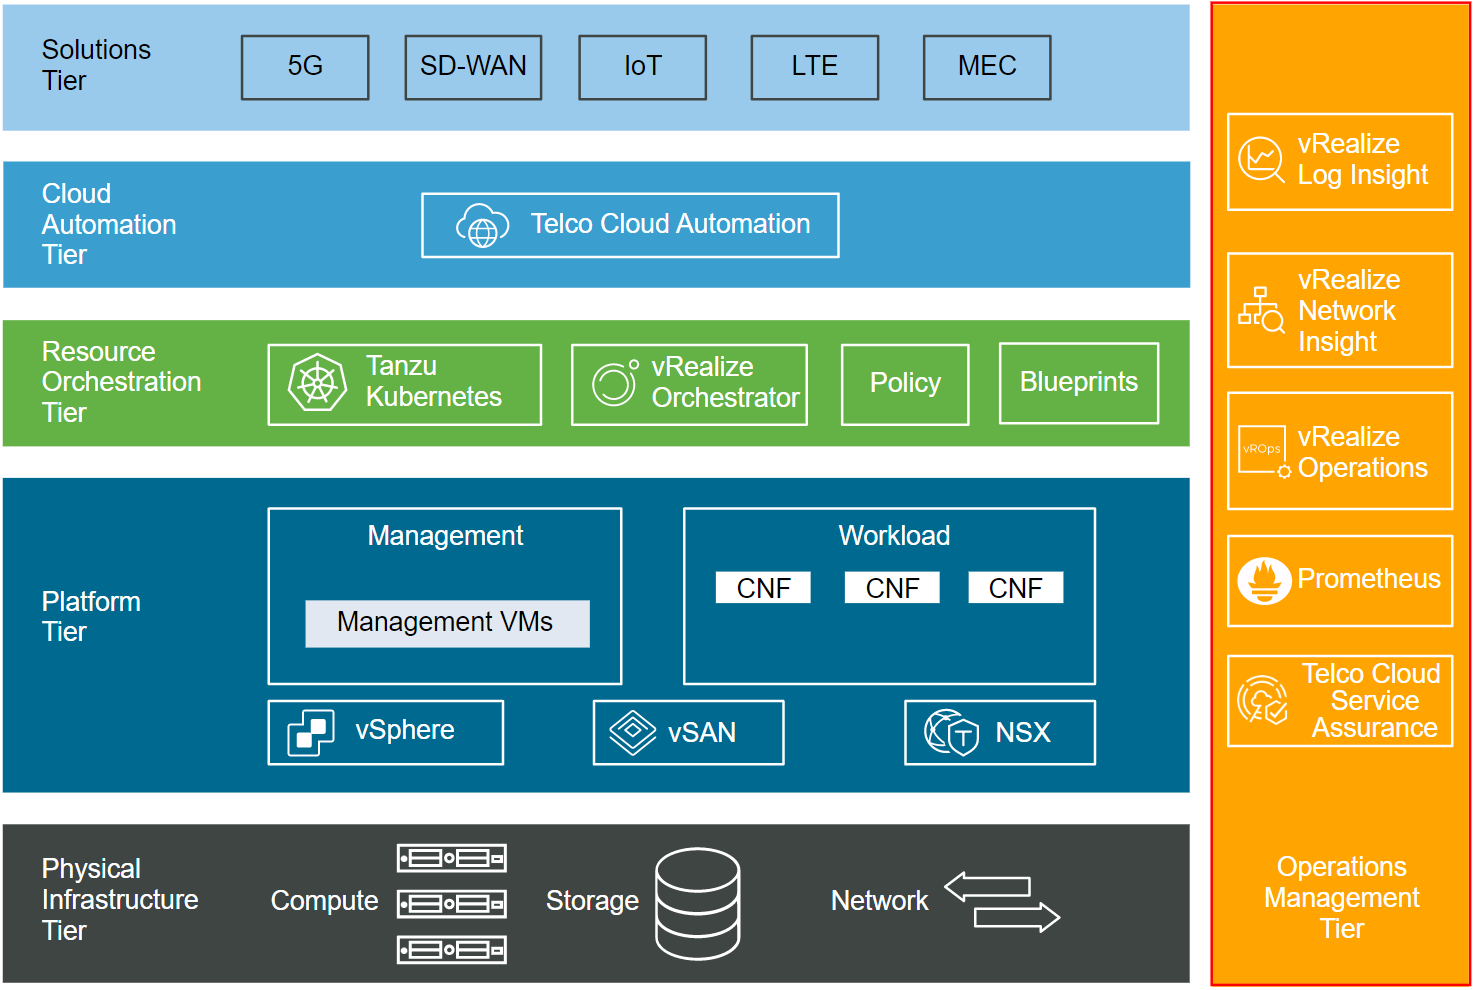
The operations management design includes optional components such as vRealize Operations, vRealize Log Insight, and Telco Cloud Service Assurance platforms that form the operations management layer in the Telco Cloud Platform RAN solution. This section provides guidance on the main design elements such as sizing, networking, and diagnostics.
The components of the operations management layer are not included in the Telco Cloud Platform RAN release bundle. However, VMware Telco Cloud Infrastructure or VMware Telco Cloud Platform 5G Edition typically has one or more of these components deployed from the vRealize Operations Suite.
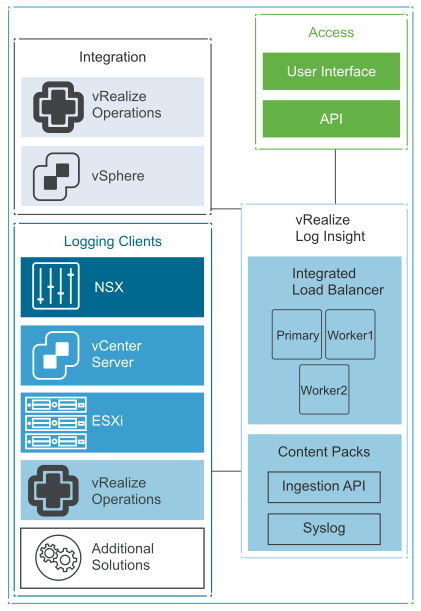
vRealize Log Insight Design
The vRealize Log Insight cluster consists of one primary node and two worker nodes behind a load balancer. The vRealize Log Insight Cluster is located in the management cluster at Regional Data Center, and all logging traffic is sent across the site-to-site link.
We recommend that you use the Integrated Load Balancer (ILB) on the three-node cluster so that all log sources can address the cluster by its ILB. By using the ILB, you do not need to reconfigure log sources with a new destination address in case of a scale-out or node failure. The ILB also guarantees that vRealize Log Insight accepts all incoming ingestion traffic.
The ILB address is required for users to connect to vRealize Log Insight using either the Web UI or API. It is also required for clients to ingest logs using syslog or the Ingestion API. A vRealize Log Insight cluster can scale out to 12 nodes: 1 primary and 11 worker nodes.
Multiple ingress IP addresses can be allocated to vRealize Log Insight. Each unique entry can implement ingress tagging for all log messages. Ingress tagging provides a high-level distinction between different elements of an environment such as RAN, Core, and so on.
To accommodate all log data in the solution, size the compute resources and storage for the Log Insight nodes correctly. By default, the vRealize Log Insight appliance uses the predefined values for small configurations: 4 vCPUs, 8 GB virtual memory, and 530.5 GB disk space. vRealize Log Insight uses 100 GB disk space to store raw data, index, metadata, and other information.
vRealize Log Insight supports the following alerts that trigger notifications about its health and the monitored solutions:
System Alerts: vRealize Log Insight generates notifications when an important system event occurs. For example, when the disk space is almost exhausted and vRealize Log Insight must start deleting or archiving old log files.
Content Pack Alerts: Content packs contain default alerts that can be configured to send notifications. These alerts are specific to the content pack and are deactivated by default.
User-Defined Alerts: Administrators and users can define alerts based on the data ingested by vRealize Log Insight.
Design Recommendation |
Design Justification |
Design Implication |
|---|---|---|
Deploy vRealize Log Insight in a cluster configuration of three nodes with an integrated load balancer:
|
|
|
Deploy vRealize Log Insight nodes of at least medium size. |
Accommodates the number of expected syslog and vRealize Log Insight Agent connections from the following sources:
Using medium-size appliances ensures that the storage space for the vRealize Log Insight cluster is sufficient for 7 days of data retention. |
If you configure vRealize Log Insight to monitor additional syslog sources, increase the size of the nodes. |
Enable alerting over SMTP. |
Administrators and operators can receive email alerts from vRealize Log Insight. |
Requires access to an external SMTP server. |
Forward alerts to vRealize Operations. |
Provides monitoring and alerting information that is pushed from vRealize Log Insight to vRealize Operations for centralized administration. |
None |
Leverage fluent-bit on the Tanzu Kubernetes clusters to forward syslog Information to vRealize Log Insight. |
Provides a central logging infrastructure for all Cell Sites. |
All logging traffic is sent over the cell site uplinks, ensure available capacity. |
vRealize Operations Design
vRealize Operations communicates with all management components to collect metrics that are presented through various dashboards and views. In Telco Cloud Platform RAN, the primary collection points include vCenter Server and Tanzu Kubernetes clusters.
The vRealize Operations deployment is a single instance of a 3-node analytics cluster that is deployed in the management cluster along with a two-node remote collector group.

The analytics cluster of the vRealize Operations deployment contains the nodes that analyze and store data from the monitored components. You deploy a configuration of the analytics cluster that meets the requirements for monitoring the number of VMs.
Deploy a three-node vRealize Operations analytics cluster that consists of one primary node, one replica node, and one data node to enable scale-out and high availability. This design uses medium-size nodes for the analytics cluster and standard-size nodes for the remote collector group. To collect the required number of metrics, add a virtual disk of 1 TB on each analytics cluster node.
The remote collectors known as cloud-proxies collect data from the compute vCenter Servers in the management cluster. The deployment of remote collectors at edge locations provides a distributed way to collect information about Tanzu Kubernetes clusters deployed throughout the RAN.
You can use the self-monitoring capability of vRealize Operations to receive alerts about operational issues. vRealize Operations displays the following administrative alerts:
System alert: Indicates a failed component of the vRealize Operations application.
Environment alert: Indicates that vRealize Operations stopped receiving data from one or more resources. This alert might indicate a problem with system resources or network infrastructure.
Log Insight log event: Indicates that the infrastructure on which vRealize Operations is running has low-level issues. You can also use the log events for root cause analysis.
Custom dashboard: vRealize Operations shows super metrics for data center monitoring, capacity trends, and a single pane of glass overview.
Design Recommendation |
Design Justification |
Design Implication |
|---|---|---|
Deploy vRealize Operations as a cluster of three nodes:
|
|
All the nodes must be sized identically. |
Deploy two remote collector nodes. |
Removes the load from the analytics cluster from collecting application metrics. |
When configuring the monitoring of a solution, you must assign a collector group. |
If required, deploy remote collectors or cloud-proxies at edge locations to distribute the collection of information from Tanzu Kubernetes clusters. |
Provides a distributed way to collect information from the RAN environment. |
Requires additional collectors and the correct allocation of remote collectors or cloud-proxies per cluster. |
Configure vRealize Operations to collect metrics from the compute vCenter Server. |
Provides operations management infrastructure for all Cell Sites. |
As the Cell Sites are added, more data nodes and remote collectors need to be added. |
Deploy each node in the analytics cluster as a medium-size appliance (at minimum). |
Provides the scale required to monitor the RAN solution. |
ESXi hosts in the management cluster must have physical CPUs with a minimum of 8 cores per socket. vRealize Operations uses a total of 24 vCPUs and 96 GB of memory in the management cluster. |
Add more medium-size nodes to the analytics cluster if the number of VMs exceeds 10,000. |
Ensures that the analytics cluster has enough capacity to meet the VM object and metric growth. |
|
Deploy the standard-size remote collector or Cloud-Proxy virtual appliances. |
Enables metric collection for the expected number of objects. |
You must provide 4 vCPUs and 8 GB memory in the management cluster or targeted endpoint. |
Add a virtual disk of 1 TB for each analytics cluster node. |
Provides enough storage for the expected number of objects. |
You must add the 1 TB disk manually while the VM for the analytics node is powered OFF. |
Configure vRealize Operations for SMTP outbound alerts. |
Enables administrators and operators to receive email alerts from vRealize Operations. |
vRealize Operations must have access to an external SMTP server. |
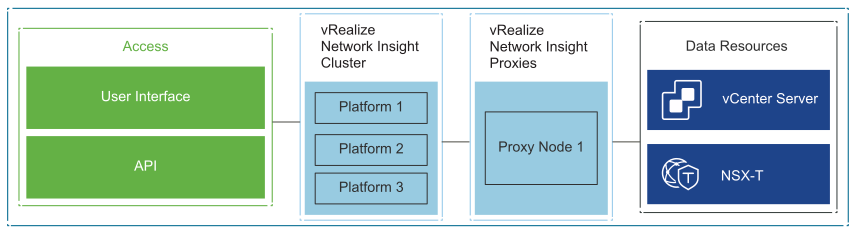
vRealize Network Insight Design
vRealize Network Insight communicates with the vCenter Server and the NSX Manager instances to collect metrics that are presented through various dashboards and views.
vRealize Network Insight is deployed as a cluster called the vRealize Network Insight Platform Cluster. This cluster processes the collected data and presents it using a dashboard. vRealize Network Insight also uses a Proxy node to collect data from the data sources, such as vCenter Server and NSX Manager, and send the data to the Platform Cluster for processing.
Design Decision |
Design Justification |
Design Implication |
|---|---|---|
Deploy a three-node vRealize Network Insight Platform cluster. |
Meets the availability and scalability requirements of up to 10,000 VMs and 2 million flows per day. |
The Management cluster must be properly sized as each vRealize Network Insight VM requires a 100% CPU reservation. |
Deploy vRealize Network Insight Platform nodes of large size. |
Large size is the minimum size supported to form a cluster. |
None |
Deploy at least a single large-sized vRealize Network Insight Proxy node. |
A single Proxy node meets the requirements of a new deployment. As the solution grows, additional Proxy nodes might be required. |
vRealize Network Insight Proxy nodes are not high-available but are protected by vSphere HA. |
Telco Cloud Service Assurance Design
VMware Telco Cloud Service Assurance is an automated service assurance solution with fault management, performance management, service management, root cause analysis, and service impact analysis in one platform.
VMware Telco Cloud Service Assurance can be deployed in a HA or non-HA model based on the number of managed devices. For more information, see the Telco Cloud Service Assurance Deployment Architecture.
The sizing of the Telco Cloud Service Assurance deployment is based on footprints that grow from 25,000 to 200,000 devices. For information about the sizing and deployment guidelines, see the Telco Cloud Service Assurance Deployment Guide.
Design Recommendation |
Design Justification |
Design Implication |
|---|---|---|
Deploy Telco Cloud Service Assurance in a HA model. |
Supports scaling from 25,000 to 200,000 devices. |
Requires additional worker node resources |
