


Examining your business applications
After you attach a data source in Tanzu Platform hub, Tanzu Platform discovers the applications that are running in the data source. You can create business applications from the discovered applications. For more information, see Managing your applications in Tanzu Platform.
As a platform engineer, to review the status of your application platforms and quickly identify problematic areas, you can examine the status of your business applications and drill down into the topology maps to locate the components that need attention.
NoteWith this version of the feature, business applications are supported only for Cloud Foundry and Kubernetes.
Before you begin
- For Spring applications in a Tanzu Platform for Cloud Foundry (formerly known as Tanzu Application Service) foundation, see Configure your Spring applications for application management in Tanzu Platform and Attach a Tanzu Platform for Cloud Foundry foundation as a Tanzu Hub data source.
- For Spring applications in a Kubernetes cluster, see Configure your Spring applications for application management in Tanzu Platform and Attach a Kubernetes cluster as a VMware Tanzu Hub data source.
- You must have the Tanzu Hub Admin service role to view the business applications in Tanzu Platform hub.
View my business applications
To view the business applications in Tanzu Platform hub, on the left navigation pane, go to Applications > Business Applications.
You can see the Status chart and the list of business applications.
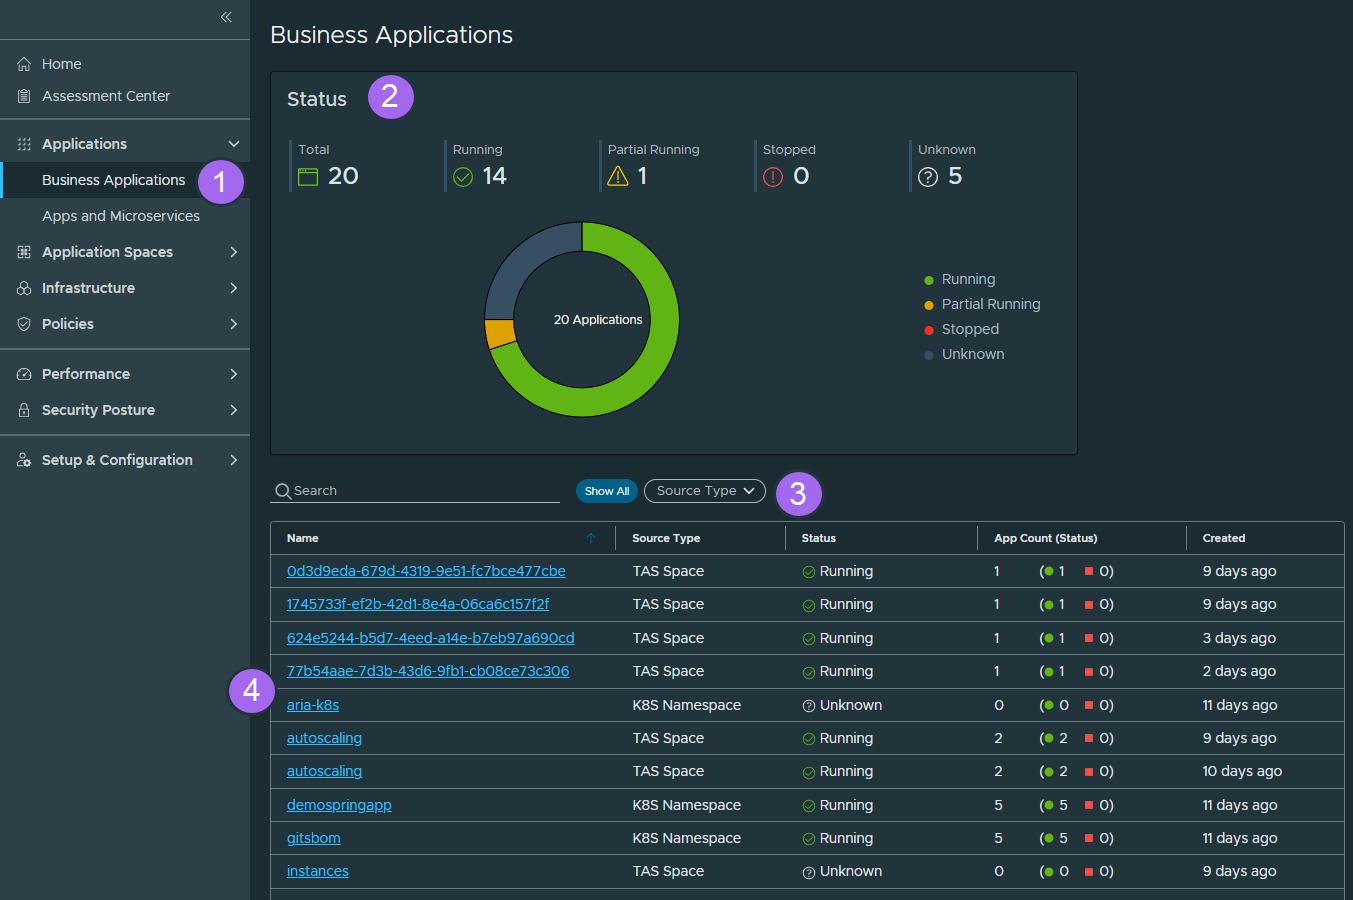
The Status chart shows the following data:
- The Total number of your business applications.
-
The number of the business applications per status. The status of a business application is based on the statuses of the applications within that business applications.
Status Description Running All applications within the business application are running. Partial Running One or more applications within the business application have stopped. Stopped All applications within the business application have stopped. Unknown No information about the applications within the business application.
Find a business application
The Business Applications page also contains a table list of the discovered business applications. You can:
- Filter by status by clicking a status on the pie chart or the legend of the Status chart.
- Search by name.
- Filter by source type.
-
Sort by the properties in the table columns.
Property Description Name The name of the business application. For an application on Kubernetes, this is the name of the Kubernetes namespace.
For an application on Cloud Foundry, this is the name of the Cloud Foundry cluster.
Source Type The source of grouping. Currently, can be a Cloud Foundry space or a Kubernetes namespace. Status The status of the business application based on the statuses of the applications within that business applications. App Count (Status) The total number of applications within that business application and the number of the applications per status. Created How long ago the business application was discovered and created in the hub.
Examine a business application
If a business application is not in running status, you can drill down into its topology to examine its components, their dependencies, and statuses.
On the Business Applications page, click the name of the business application you want to examine. The business application details page opens.
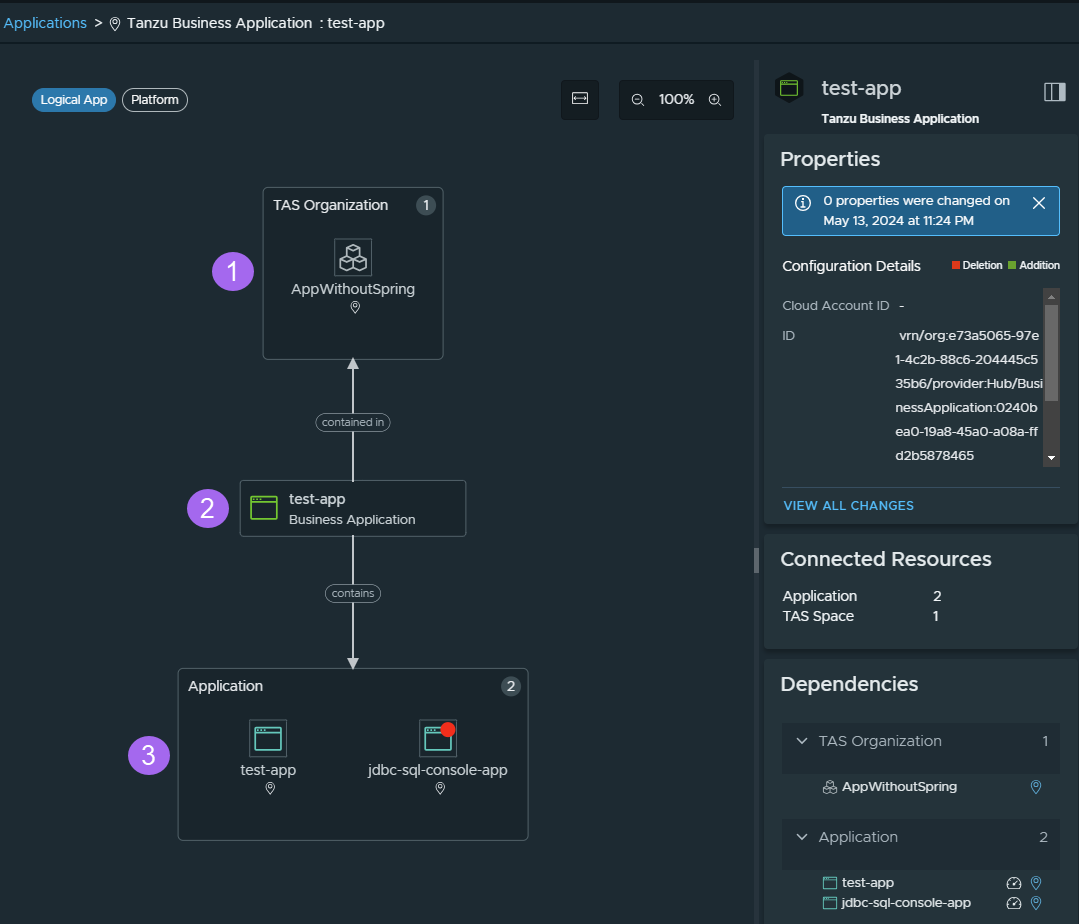
On the details page, you can examine the topology maps of the business application. To switch between the two topology maps, use the selector on the top left.
| Topology Map | Description |
|---|---|
| Logical App | Shows the dependencies and the dependents of the business application. An arrow between two components indicates a dependency and its direction. The text on an arrow indicates the type of relationship between the dependent components. In our example: 1 - 2 - 3 - |
| App Platform | Shows a high-level overview of the components that make up the application platform in the scope of the business application. This includes details about the application services, availability zones, routes, foundation, etc, and how your business application depends on these components. If a Business Applications is comprised of more tha one Tanzu Platform Spaces or K8s Namespaces, they wil show up here in the App Platform view |
NoteA red dot in a component on the map indicates that this component is not running and needs attention.
When you click a component on a topology map, the panels on the right dynamically show the following information for the selected component:
| Panel | Description |
|---|---|
| Properties | Shows the configuration details of the component that is selected on the topology map. For example, if you click a Spring application on the topology map, this panel shows the collected actuator-based Spring application configuration key values and Git information. You can examine the history of the changes of the properties. |
| Connected Resources | The number of connected resources by type for the component that is selected on the topology map. |
| Dependencies | A textual representation of the dependencies of the component that is selected on the topology map. |
Parent topic: Monitoring your applications in the Tanzu Platform hub
