


Troubleshooting your Spring applications and microservices
After you configure your Spring applications with actuator and micrometer libraries, and attach your application platforms to the Tanzu Platform hub, the hub discovers the applications and microservices that are running on these platforms. After the application discovery, the hub starts collecting metrics and other data from the applications and the platforms on which they are running.
NoteWith this initial version of the feature, Tanzu Platform supports only Spring-based applications on Tanzu Platform for Cloud Foundry and Kubernetes.
As an application engineer, if an application or microservice needs attention, you can examine its dashboard and quickly find troubleshooting information.
Before you begin
- For Spring applications in a Tanzu Platform for Cloud Foundry foundation, see Configure your Spring applications for application management in Tanzu Platform and Attach a Tanzu Platform for Cloud Foundry foundation as a VMware Tanzu Hub data source.
- For Spring applications in a Kubernetes cluster, see Configure your Spring applications for application management in Tanzu Platform and Attach a Kubernetes cluster as a VMware Tanzu Hub data source. <!—- For Spring applications on virtual machines in an AWS public cloud environment, see Add Tanzu Salt for Spring app discovery on virtual machines.—>
- You must have the Tanzu Hub Admin service role to view the Spring applications and the application dashboards in the hub.
View my applications and microservices
To view the discovered applications and microservices, in the left navigation pane, select Applications > Apps and Microservices.
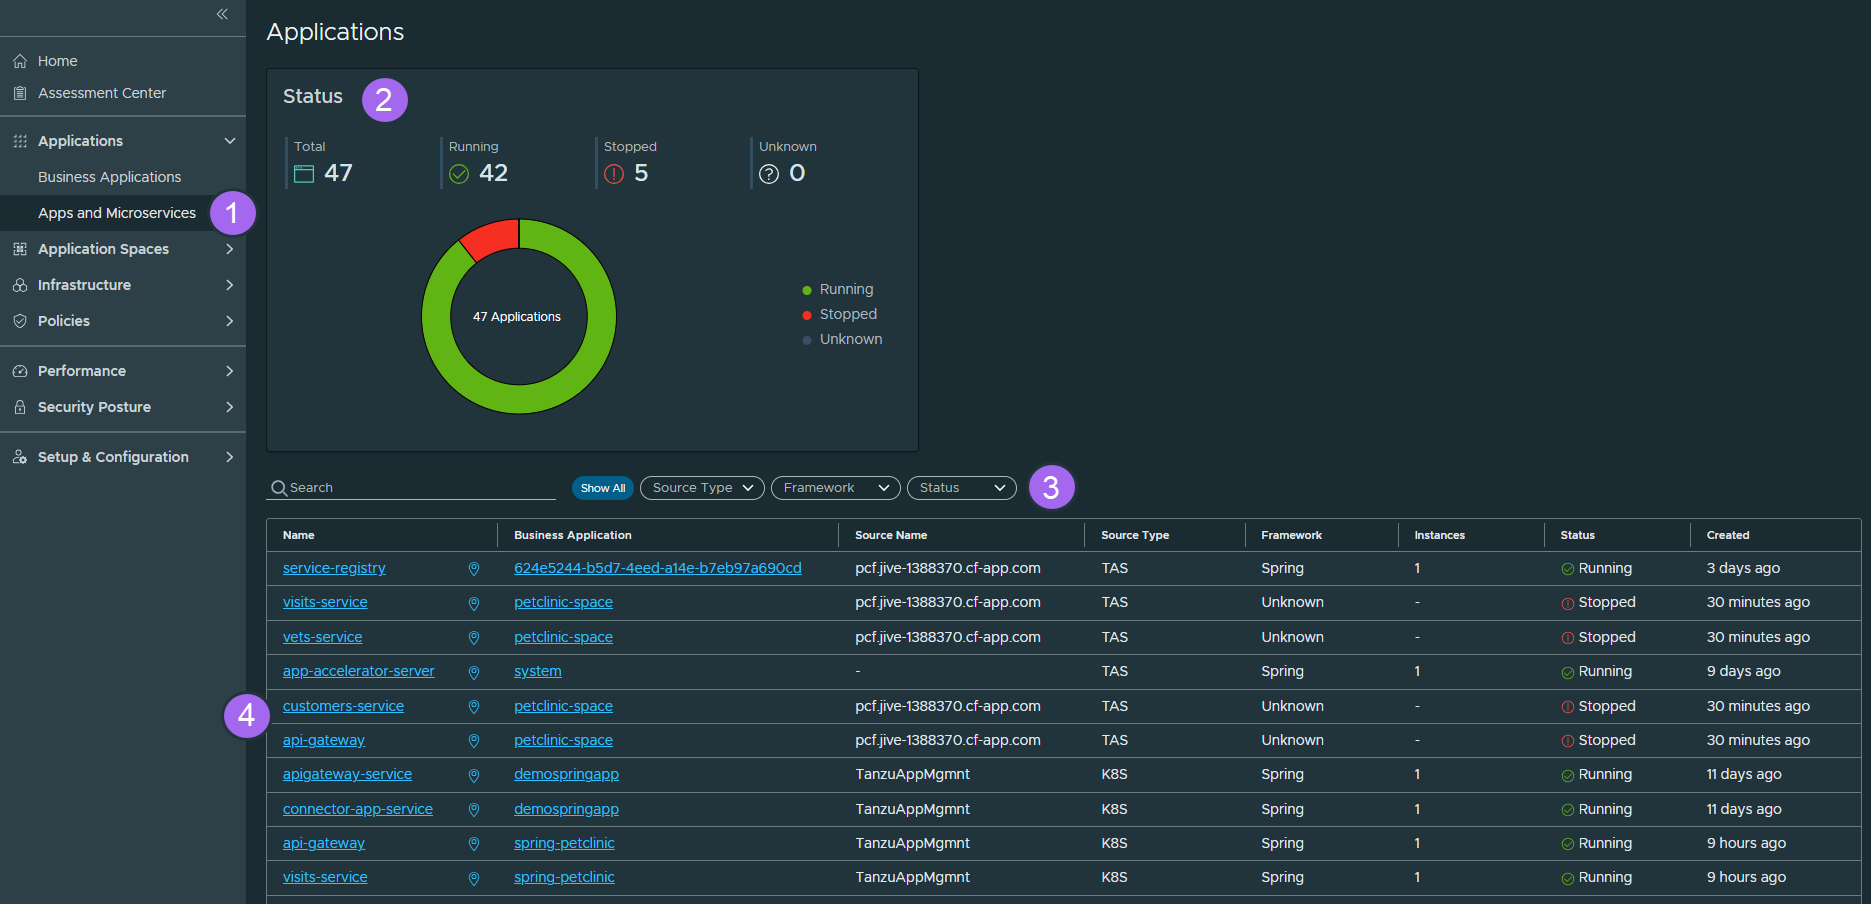
View the statuses of my applications and microservices
The Applications page contains the Status chart, which shows:
- The Total number of the applications.
-
The number of the applications per status.
Status Description Running The application is running. Stopped The application is not running. Unknown No information about the status of the application. Check if the actuator is enabled correctly. See Enable Actuator in your Spring applications.
Find an application or microservice
The Applications page also contains a table list of the discovered applications and microservices. You can:
- Search by name.
- Filter by source type, framework, and status.
-
Sort the table by the properties in the columns.
Property Description Name The name of the application. For an application on Kubernetes, see Verify the Spring application name.
For an application on Cloud Foundry, this is the Cloud Foundry application name.
You can click the name of an application to open its application dashboard. See How to troubleshoot a Spring application or microservice.
Business Application The name of the business application to which the application belongs. For an application on Kubernetes, this is the name of the Kubernetes namespace.
For an application on Cloud Foundry, this is the name of the Cloud Foundry cluster.
You can click the name of a business application to open its topology map. See How to examine a business application.
Source Name The name of the source. Source Type The source platform type. Currently, can be Cloud Foundry, K8s, or AWS. Framework The framework of that application. Instances The number of instances of that application. Status The status of the application. Created How long ago the application was discovered and created in the hub.
Troubleshoot a Spring application or microservice
If an application or microservice needs attention, you can examine its dashboard to gain valuable information about its performance and troubleshoot any problems that may arise.
To open an application dashboard, on the Applications page, click the name of the application you are interested in.
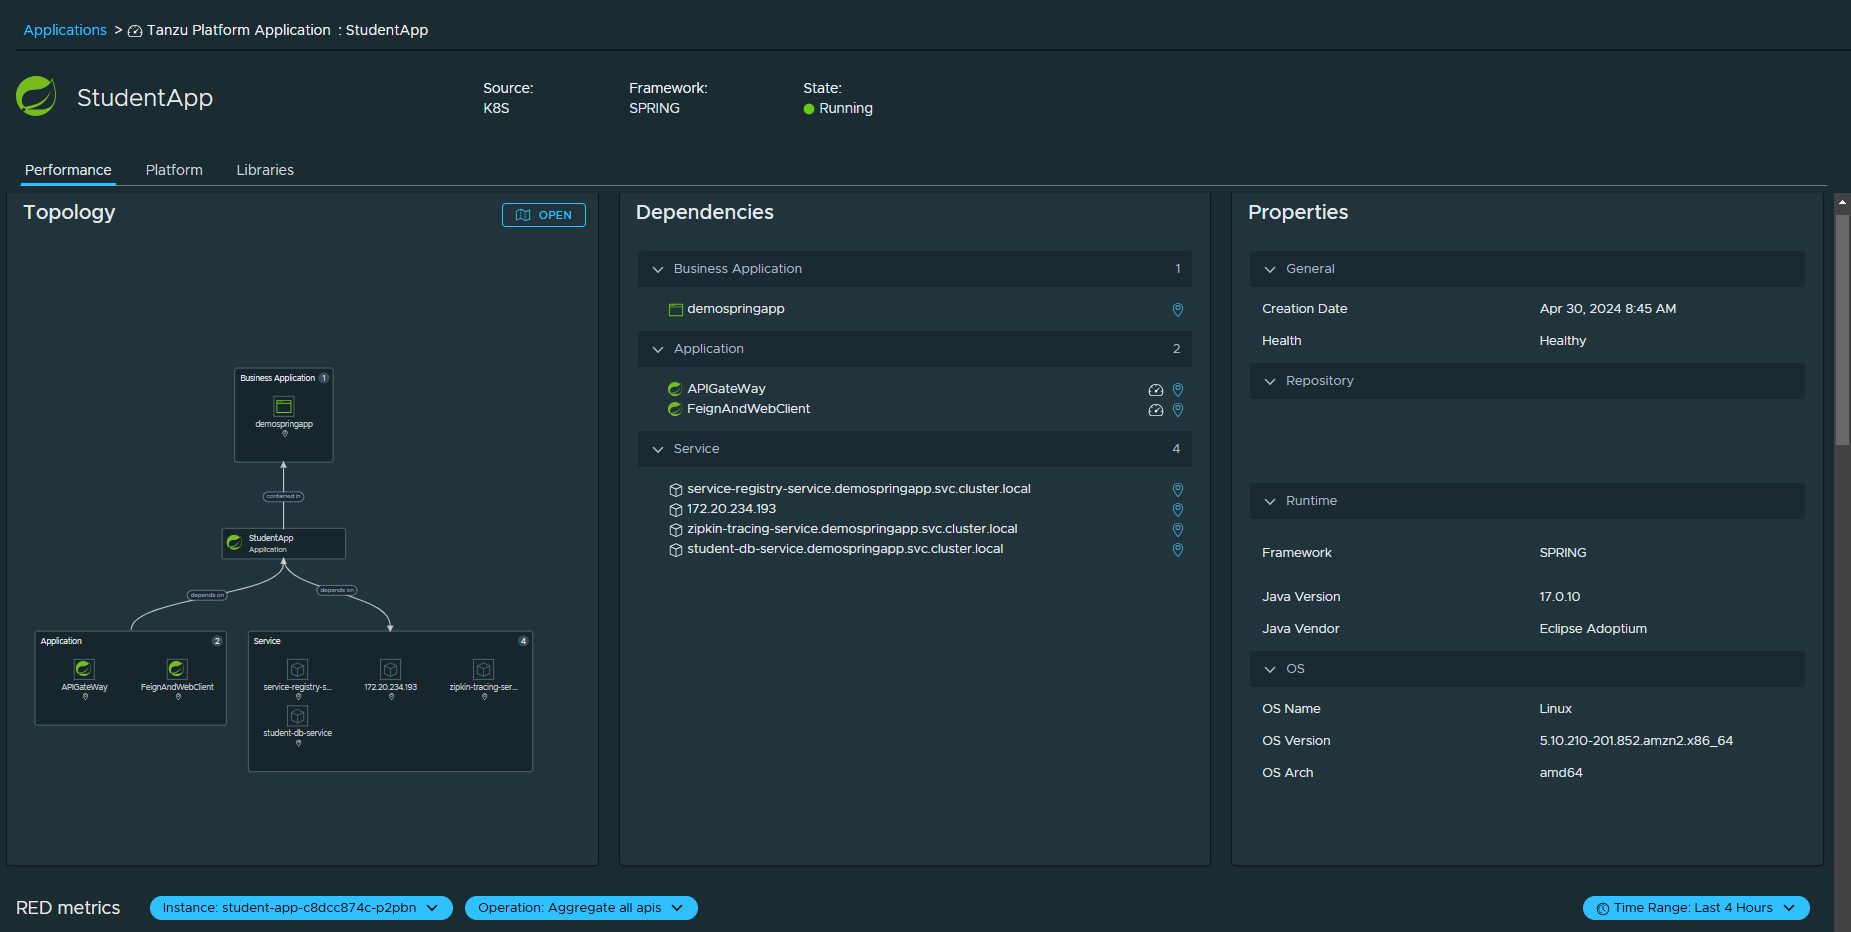
The application dashboard is organized in three tabs.
-
The Performance tab includes a number of panels:
Tab Description Topology Shows the logical topology map of the application. An arrow between two components indicates a dependency and its direction. The text on an arrow indicates the type of relationship between the dependent components. For example, an arrow with the
contained intext from the application to a business application means that the application is within this business application.Dependencies A textual representation of the dependencies of the application. Properties Shows the configuration details of the application, that is, the collected actuator-based Spring application configuration key values and Git information, if enabled. You can also examine the history of the changes of the properties. RED metrics Shows charts of an application operation request rate, errors, and latency. You can select the application instance, the application operation, and the time range for the data in the charts. This data is collected if you added the Micrometer and Wavefront tracing libraries to your Spring applications. See Add Micrometer and Wavefront tracing libraries. JVM metrics Shows charts of the JVM memory usage, CPU usage, and thread activity for an application instance. You can select the application instance and the time range for the data in the charts. This data is collected if you added the Micrometer and Wavefront tracing libraries to your Spring applications. See Add Micrometer and Wavefront tracing libraries. - The Platform tab shows the platform topology map, services, and properties of the application. The services are the applications that are not developed by the application developer but are rather just used as dependencies, such as datastores (Postgres etc.), message queues (RabbitMQ), and 3rd party services outside the business applications boundary that the applications depend on.
- The Libraries tab shows information about the used libraries, such as vulnerabilities, support, and upgrades. This data is collected if you added the CycloneDX plugin to your Spring applications. See (Optional) Add SBOM info for your Spring applications.
- If the performance tab does not show any metric values on the charts verify that the Spring configuration and library versions are accurate. The Spring application needs some request activity for metric charts to show values.
Parent topic: Monitoring your applications in the Tanzu Platform hub
