


When VMware Aria Operations (SaaS) is integrated with VMware Aria Operations for Logs (SaaS), you can search for these logs, view the logs for an object, and launch the VMware Aria Operations for Logs service from VMware Aria Operations.
Supported Objects
- vSphere
- VMware vSAN clusters, Disks and Disk Groups
- vCenter
- ESXi hosts, and virtual machines
- NSX Services:
- Load Balancer Virtual Server
- Load Balancer Pool
- Load Balancer Service
- Logical Switch
- Logical Router
- Firewall Section
- Group
- Transport Zone
- Transport Node
- Edge Cluster
- Router Service
- Management Appliances
- Manager Cluster
- Load Balancers
- Manager Node
- NSX Manager Service
Integrating the Services
- A source field with a valid IP, and not an automated IP such as 169.x.x.x.
- A hostname field.
- For more information on deploying a cloud proxy, see the topic, Deploy a Cloud Proxy for VMware Aria Operations for Logs (SaaS).
- For information about configuring vCenter and ESXi, see:
If you are a VMware Cloud on AWS user, you do not have to deploy a cloud proxy. You also do not have to configure vCenter or an ESXi host, because audit and firewall logs for these objects are already available.
To publish the application or guest OS logs from a virtual machine, you must deploy a VMware Aria Operations for Logs Agent in the virtual machine. The agent helps forward the virtual machine guest OS logs to the cloud proxy for VMware Aria Operations for Logs. For information about VMware Aria Operations for Logs Agents and how to install and configure them, see the topic, Working with VMware Aria Operations for Logs Agents.
Log Analysis
- From the left the menu, select .
- By selecting an inventory object from the left pane of the page, and clicking the Logs tab.
You can also create a dashboard which displays the log analysis screen.
You can troubleshoot a problem in your environment by correlating the information in the logs with the metrics, which might help you determine the root cause of the problem. By default, the Logs tab displays different event types for the last five minutes. For vSphere objects, the logs are filtered to show the event types for the object that you select and logs from supported objects within that hierarchy.
The supported objects are vSphere, vCenter, ESXi hosts, and virtual machines. The supported VMware vSAN objects are cluster, Disk Groups and Disks. If an object that is not supported has objects that are supported within its hierarchy, the enclosing object shows logs from the objects within its hierarchy. For example, if a cluster has ESXi hosts and virtual machines within its hierarchy, the cluster shows logs from ESXi hosts and virtual machines.
The log analysis screen in the log analysis page, the logs tab of an object, and dashboards looks like the image below:
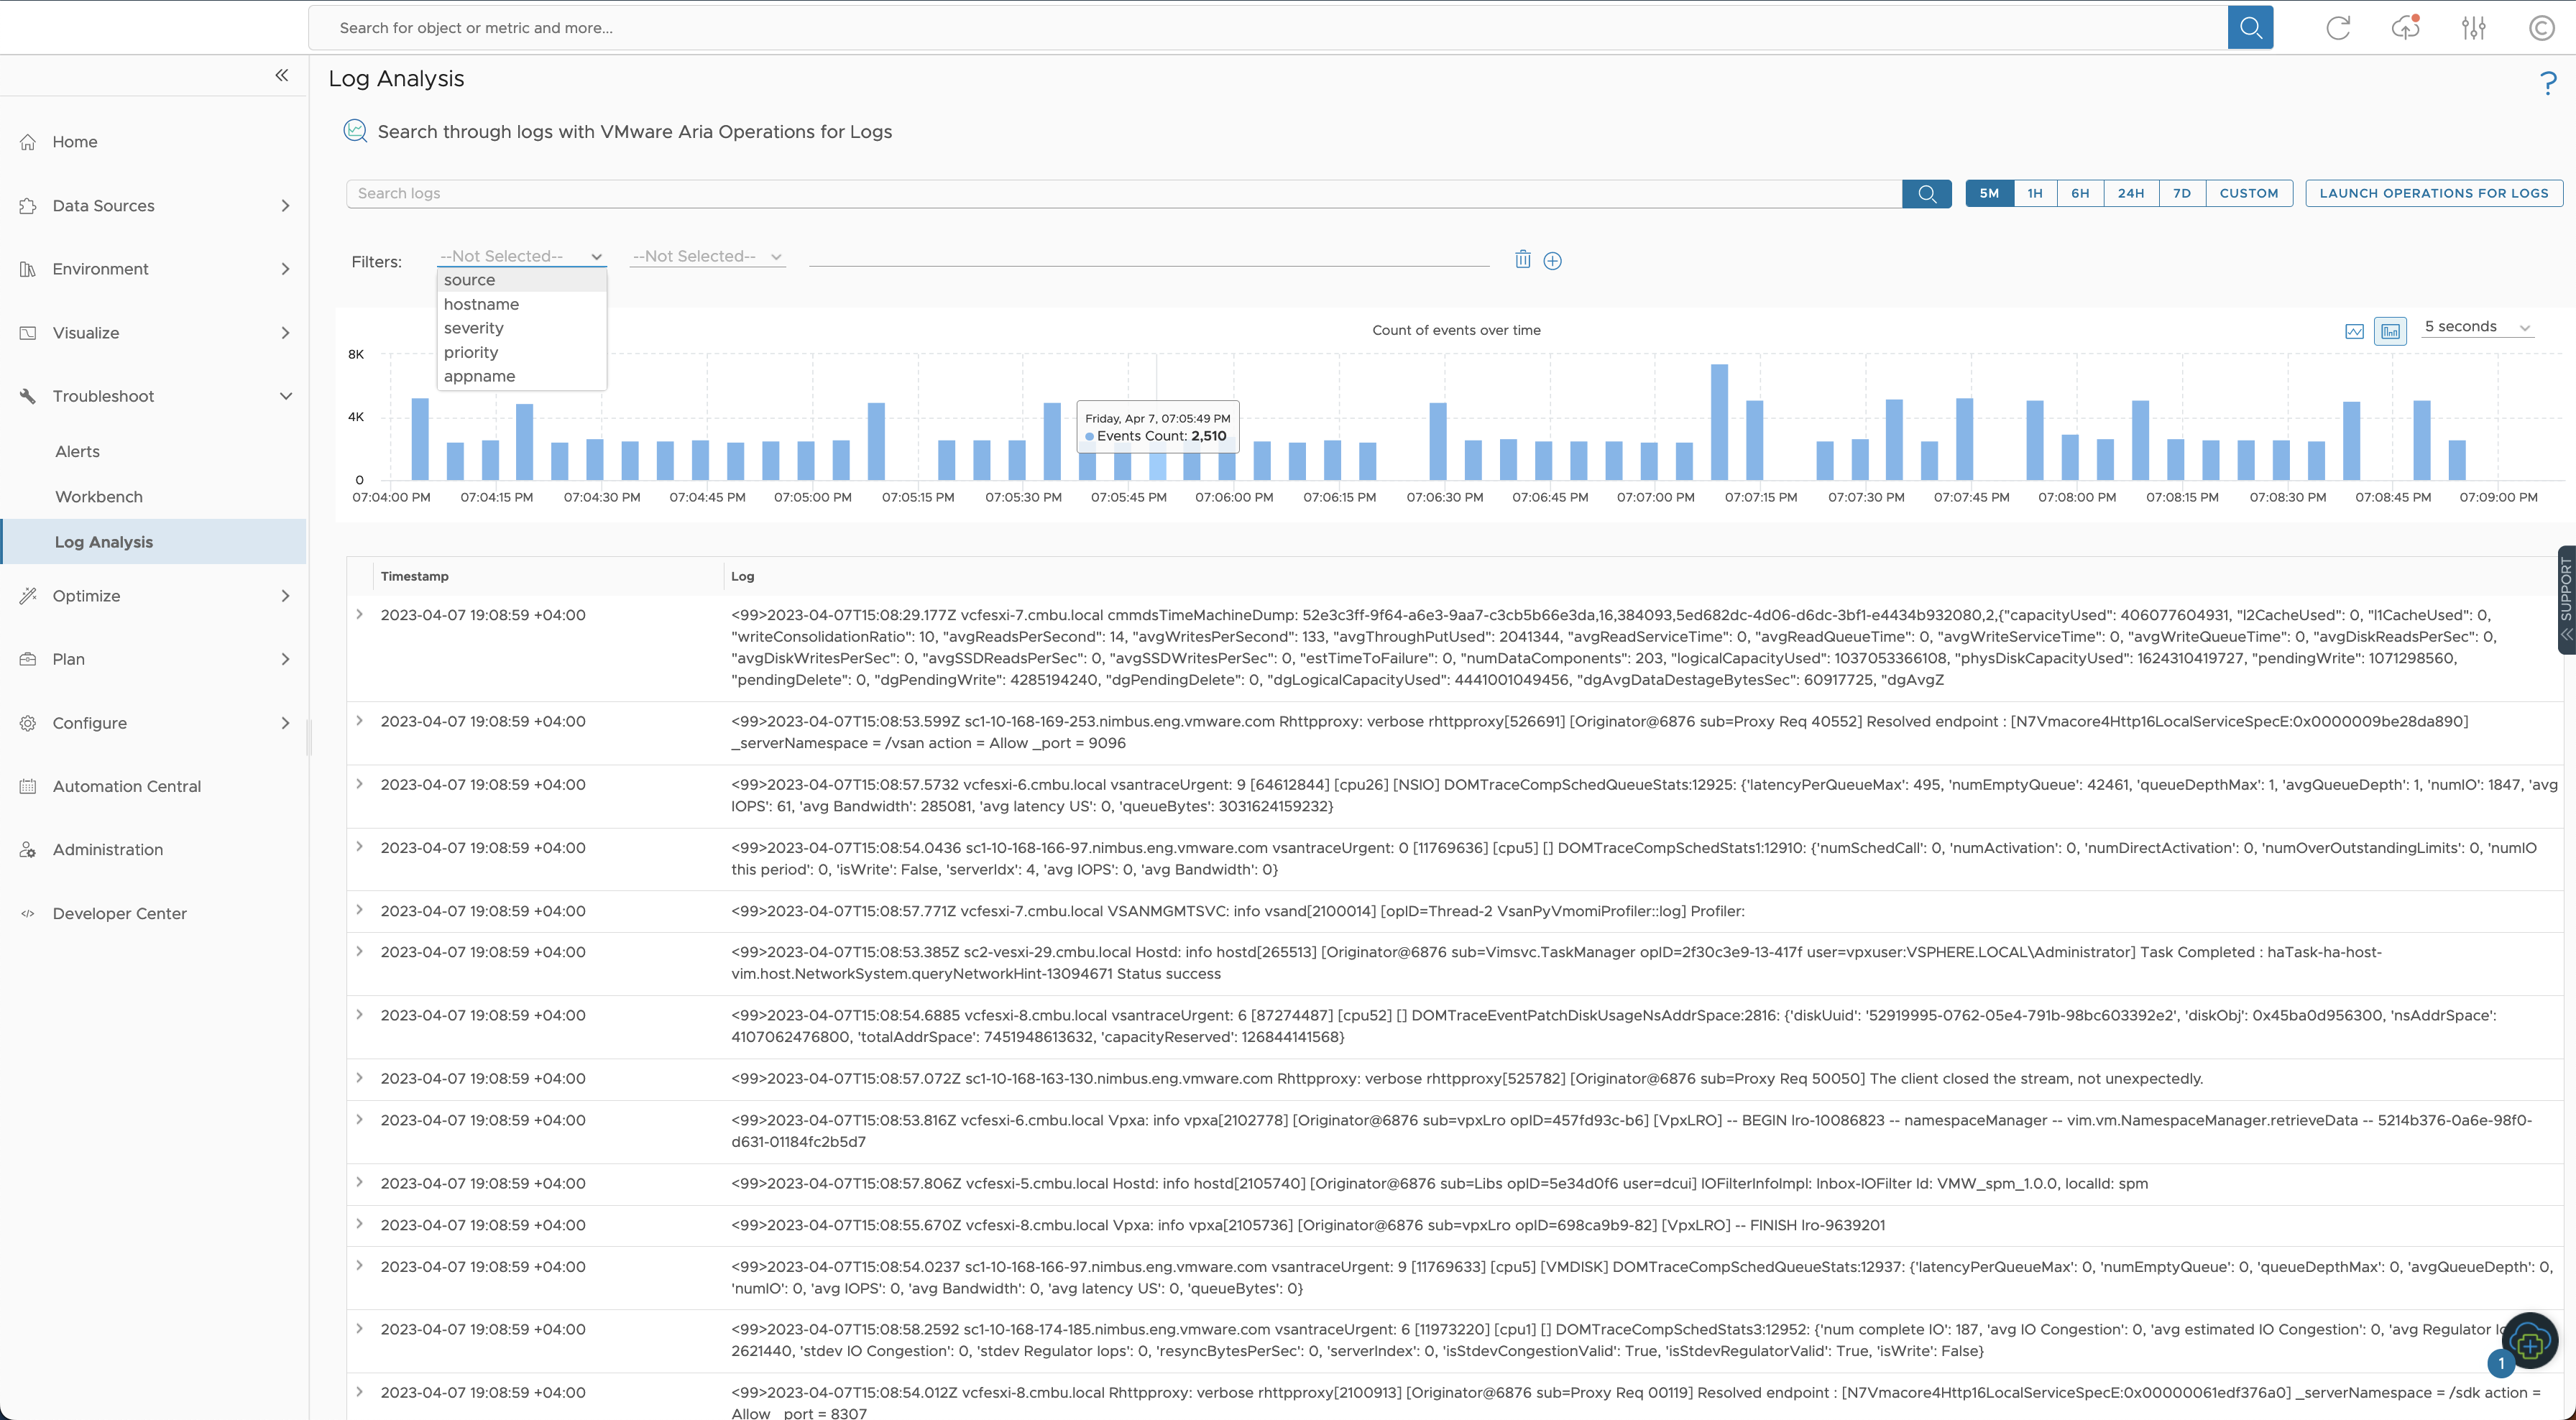
On this screen, you can quickly search for logs or filter down the logs displayed using the following options:
- Text Based Search
-
- Search bar: On the top of the screen is a search bar to search for logs.
- Time duration of logs: Change this value to display logs from a different time duration. The default is 5 minutes. Use Custom for a custom time duration.
- Advanced filtering
-
Use the advance filtering to narrow down the logs you are looking for.
VMware Aria Operations parses the logs and gives you advanced filtering capabilities.
- Filters: Filters. Use source, hostname, severity, priority, and appname filters.
- Condition operators: Use filters with the contains, doesnotContain, startsWith, doesNotStartWith, matchesRegex, exist, and doesNotExist conditions.
- Query box: Input a query in the query box to filter the logs displayed.
The log analysis screen displays the event timeline in a bar chart by default. This tells you how the logs have spiked for the given time duration. You can correlate spikes in logs with metrics to narrow down the root cause of an issue. On the screen, you can change the event timeline frequency between 1 second, 5 seconds and 1 minute. You can switch from the bar graph to a line graph.
The logs are displayed in the bottom half of the page in a table which contains a timestamp and log column. In the table which displays the logs, you can expand a log to see more details.
Viewing Logs in VMware Aria Operations for Logs
Click the LAUNCH OPERATIONS FOR LOGS button to view the VMware Aria Operations logs in VMware Aria Operations for Logs.
From the Explore Logs page in VMware Aria Operations for Logs, you can create queries to extract events based on timestamp, text, and fields in log events. VMware Aria Operations for Logs presents charts of the query results.
For information about VMware Aria Operations for Logs, see the VMware Aria Operations for Logs documentation.
