


You access the NSX Intelligence visualization page by clicking in the NSX Manager user interface.
After you activate and configure the NSX Intelligence feature for the first time, when you click , NSX Intelligence begins to render some visualization after some network traffic data has been received from the transport nodes and the inventory information is received from NSX Manager.
By default, when you click Discover & Take Action, you see the visualization of the security posture of all the groups defined in your on-premises NSX inventory.
If there are no groups defined yet, there are no groups displayed.
Groups might have allowed, blocked, and unprotected traffic flows between their compute member entities in the last hour.
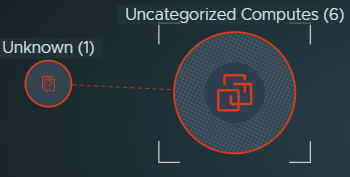
If there are VMs or physical servers, but they do not belong to any group, you see the icon for the Uncategorized Computes group.
If there are IP addresses that do not belong to any group, you see the Unknown icon.
If you already have defined groups, you might see a visualization similar to the following image, which illustrates a visualization of an NSX data center's security postures with the Last 1 Month as the selected time period to use. The table that follows the image describes the annotated sections in the image.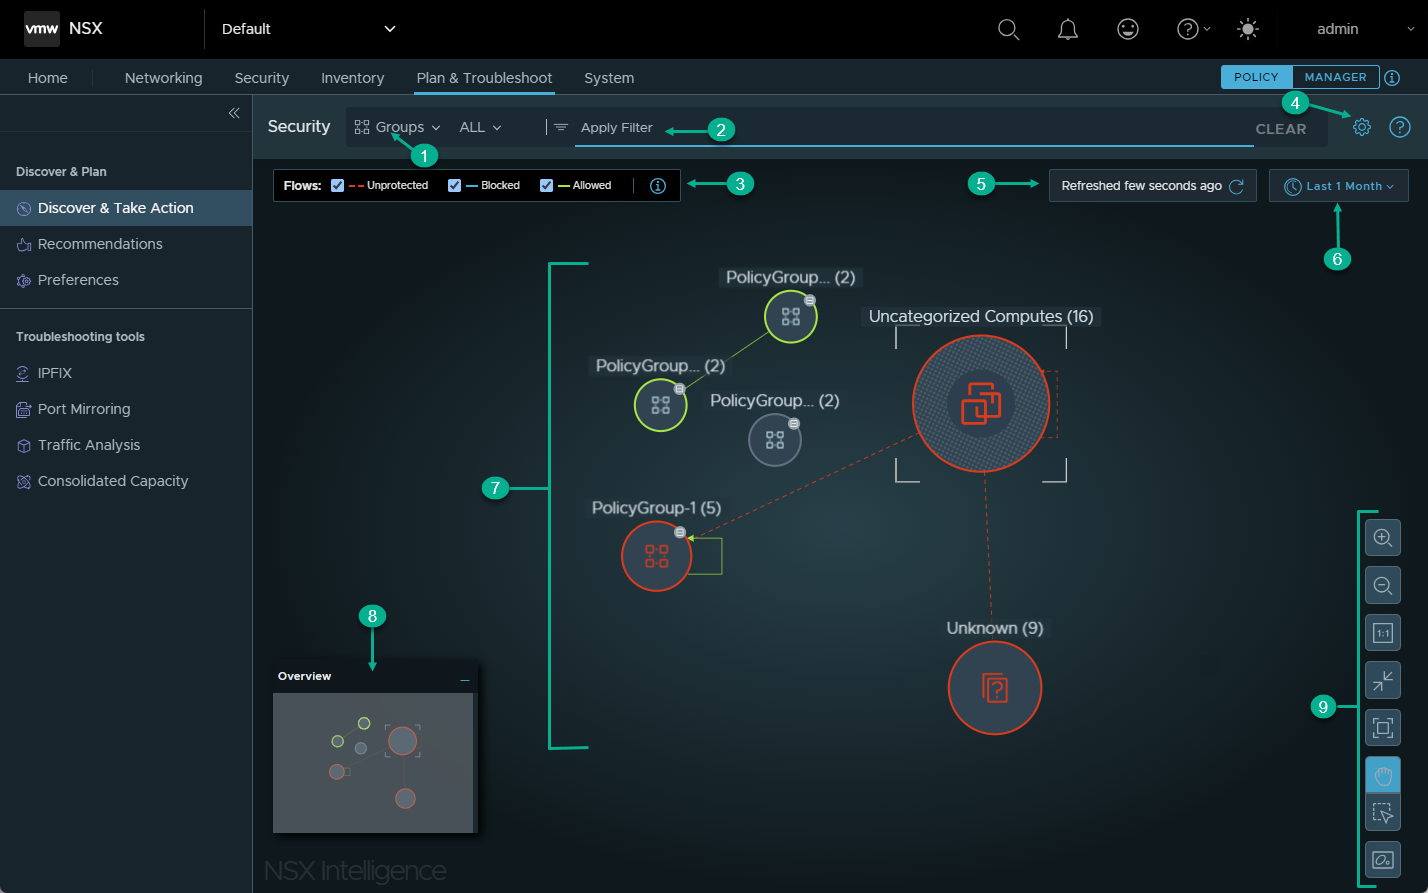
Section |
Description |
|---|---|
1 |
In the Security section, you can select the type of NSX objects whose security posture you want displayed. The two types of objects are Groups and Computes. When you click for the first time, the default Security view displayed is the Groups view. This view displays all the group objects in your NSX environment during the specified time period, which is initially set to Now.
See Working with the Groups View in NSX Intelligence and Working with the Computes View in NSX Intelligence for more information on how to work with the two view types. |
2 |
In the Apply Filter section, you can refine the display criteria used for the current visualization. Click Apply Filter, select the filter criteria, and click Apply. You can specify multiple filters by clicking Apply Filter again. See Use Filters on the NSX Intelligence Visualization UI for more details. |
3 |
With the
Flows section, you can select which traffic flow type you want to include in the visualization for the selected time period. The colors used in the visualization for the flow types gets displayed in this section.
By default, all the traffic flow types are selected for the current NSX Intelligence visualization. See Working with Traffic Flows in NSX Intelligence for more information. |
4 |
When you click the gear icon
 , links to the following settings pages are provided in the
NSX Intelligence Related Settings dialog box. , links to the following settings pages are provided in the
NSX Intelligence Related Settings dialog box.
|
5 |
The refresh status section gives information as to when the visualization graph was last refreshed. To force a refresh of the current view, click the refresh icon |
6 |
In the time period selection section, you select the time period that determines the historical network traffic flow data that NSX Intelligence uses to generate the desired visualization and microsegmentation recommendation. The time period is relative to the current time and some time period in the past. Now is the default time period used when you first click . This option displays the most recent traffic flow data that the system has captured, up to the most recent one million traffic flows processed. To change the selected time period, click the currently selected time period and select another from the drop-down menu. You can select Now, Last 1 Hour, Last 12 Hours, Last 24 Hours, Last 1 Week, Last 2 Weeks, or Last 1 Month. |
7 |
The canvas section displays the visualization graph of the security postures of the groups or compute entities in your NSX environment. It also includes the visualization of the traffic flows that have occurred during the selected time period. In this section, you can point to a specific node or flow arrow to obtain details about that specific entity. By default, if there are less than 500 nodes and less than 5000 flows to display, NSX Intelligence does not apply any clustering mode to the security posture visualization. If those nodes and flows limits are exceeded, NSX Intelligence clusters the nodes based on the traffic flow that has occurred between the compute entities during the selected time period. See Getting Familiar with NSX Intelligence Graphic Elements and Understanding the Views and Flows in NSX Intelligence for more information. |
8 |
The Overview map is a miniature version of the whole visualization graph. When you zoom into specific entities shown in the graph, the mini-map gets updated to highlight where your current view is located relative to the overall visualization graph. When you click in the mini-map window and drag the opaque rectangular overlay, your current view of the visualization graph also gets updated. This becomes very useful when you have a very large inventory in your NSX environment. |
9 |
Use the following viewing control icons to change the viewing mode applied to the visualization graph.
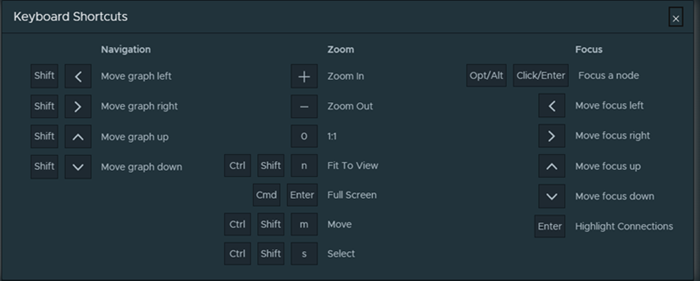
You can also use keyboard hotkeys to manage your viewing controls. To display the
Keyboard Shortcuts Help window, press Shift+click the
/ key.
To navigate to a previously viewed visualization, use your Web browser's back button. If you are in full-screen mode and you want to return to the previous visualization, press ESC to exit the full-screen mode and use your Web browser's back button. |
 . See
. See  .
. to zoom in on the view.
 to zoom out the view.
 to apply a 1:1 aspect ratio the visualization graph.
 to resize the view to fit the screen.
 to go into a full screen viewing mode. Press ESC to exit the full-screen mode.
 to move items on the graph. To shift to the Move mode when you are using the Select mode, press and hold the spacebar, and drag your pointer around the UI to move objects in the visualization graph.
 to select nodes in the graph. You can drag your pointer to select multiple nodes, or press Shift and click each node you want to select.
 to view the graph using the available clustering mode. The available modes are